Since a logarithmic spiral is defined by
$r=e^{a\cdot\theta}$,
the inverse of the equation is this:
$\theta=\frac{\ln{r}}{a}$.
If we want to be able to control our step value, we can multiply it by a scalar ($a\cdot k$) before taking the logarithm, like so:
$\theta=\frac{\ln (ak\cdot r)}{a}$
Therefore, if we take the natural log of theta multiplied by the scalar and $a$, then divide the whole thing by $a$ before plugging it in to the equation, we will get equally stepped vertices on the logarithmic spiral. Image:
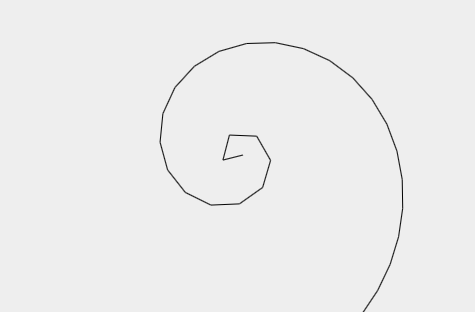
I generated this with some JavaScript code, which you can find in this JSFiddle.
You can also try it out interactively on Desmos.
This looks good initially, but let's analyze what's going on here a little deeper.
Here is a list of the distance between each consecutive pair of points, starting at the origin and spiraling outward:
20.6834877876017 25.8265879847751 27.3020264943519 27.9155365639631 28.2274404549991 28.4072329605331 28.5201842104742 28.5957343926866 28.6487385499231 28.6873487186944 28.7163404861061 28.7386617798632 28.7562121095165 28.7702600892245 28.7816791255158 28.7910864406300 28.7989282185451 28.8055334775293 28.8111491387549 28.8159634339811 28.8201218817722 28.8237384111142 28.8269032465565 28.8296885891879 28.8321527704665 28.8343433306399 28.8362993285731 28.8380530946981 28.8396315754034 28.8410573741728 28.8423495651939 28.8435243345428 28.8445954894748 28.8455748659368 28.8464726569062 28.8472976786488 28.8480575879711 28.8487590604974 28.8494079377702 28.8500093492502 28.8505678139929 28.8510873257846 28.8515714247378 28.8520232577561 28.8524456298024 28.8528410475339 28.8532117565801 28.8535597734869 28.8538869132081 28.8541948128041 28.8544849519687 28.8547586708355 28.8550171854833 28.8552616014621 28.8554929256347 28.8557120765606 28.8559198936319 28.8561171451194 28.8563045352784 28.8564827106597 28.8566522656712 28.8568137475608 28.8569676608282 28.8571144711722 28.8572546090145 28.8573884726640 28.8575164311457 28.8576388267439 28.8577559773038 28.8578681782850 28.8579757046362 28.8580788124715 28.8581777406078 28.8582727119331 28.8583639346897 28.8584516035825 28.8585359008445 28.8586169971792 28.8586950526148 28.8587702173116 28.8588426322609 28.8589124299770 28.8589797350751 28.8590446648521 28.8591073297703 28.8591678339633 28.8592262756316 28.8592827474659 28.8593373370150 28.8593901270040 28.8594411956751 28.8594906170532 28.8595384612331 28.8595847946223 28.8596296801627 28.8596731775581 28.8597153434631 28.8597562316691 28.8597958932898 28.8598343768895 28.8598717286685 28.8599079925824 28.8599432104601 28.8599774221564 28.8600106656362 28.8600429770912 28.8600743910437 28.8601049404189 28.8601346566671 28.8601635697958 28.8601917084984 28.8602191001836 28.8602457710551 28.8602717461905 28.8602970495771 28.8603217041829 28.8603457319945 28.8603691540817 28.8603919906349 28.8604142610140 28.8604359837728 28.8604571767236 28.8604778569632 28.8604980408853 28.8605177442508 28.860536982199 28.8605557692684 28.8605741194424 28.8605920461606 28.8606095623542 28.8606266804642 28.8606434124606 28.8606597698673 28.8606757637894 28.8606914049092 28.8607067035307 28.8607216695845 28.8607363126319 28.8607506419126 28.8607646663229 28.8607783944441 28.8607918345695 28.8608049947040 28.8608178825589 28.8608305056052 28.8608428710407 28.8608549858324 28.8608668567086 28.8608784901671 28.8608898925065 28.8609010698021 28.8609120279379 28.8609227726126 28.8609333093227 28.8609436434116 28.8609537800355 28.8609637242006 28.8609734807368 28.8609830543426 28.8609924495660 28.8610016707985 28.8610107223272 28.8610196082769 28.8610283326623 28.8610368993920 28.8610453122201 28.8610535748236 28.8610616907611 28.8610696634759 28.8610774963191 28.8610851925415 28.8610927553168 28.8611001876897 28.8611074926601 28.8611146731067 28.8611217318631 28.8611286716494 28.8611354951266 28.8611422048820 28.8611488034280 28.8611552932030 28.8611616766001 28.8611679559112 28.8611741333984 28.8611802112609 28.8611861916049 28.8611920765250 28.8611978680366 28.8612035681006 28.8612091786388 28.8612147015119 28.8612201385397 28.8612254914896 28.8612307620868 28.8612359520116 28.8612410629093 28.8612460963629 28.8612510539384 28.8612559371502
The first data point is an outlier caused by the spiral almost "lapping" itself. As the spiral progresses, we can see the the distances get closer and closer to the same distance.
This is because we are sampling the curve in increments that cause equal lengths along the curve, not equal lengths between consecutive points. As the spiral gets bigger and bigger, the curve will get shallower and shallower, so the distances will get closer and closer to each other.