A Grammar of Graphics for Kotlin.

![]()

Lets-Plot Kotlin API is a Kotlin API for Lets-Plot Multiplatform plotting library,
which is built on the principles of layered graphics first described in the
Leland Wilkinson work The Grammar of Graphics.
 | Lets-Plot Kotlin API is largely based on the API To learn more about the Grammar of Graphics, This will be a good prerequisite for further exploration of the Lets-Plot library. |
Inside Kotlin Notebook, Datalore or Jupyter with Kotlin Kernel:
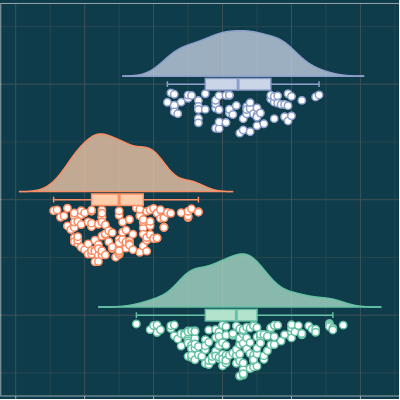
%use lets-plot val rand = java.util.Random() val data = mapOf( "rating" to List(200) { rand.nextGaussian() } + List(200) { rand.nextGaussian() * 1.5 + 1.5 }, "cond" to List(200) { "A" } + List(200) { "B" } ) var p = letsPlot(data) p += geomDensity(color = "dark_green", alpha = .3) { x = "rating"; fill = "cond" } p + ggsize(700, 350)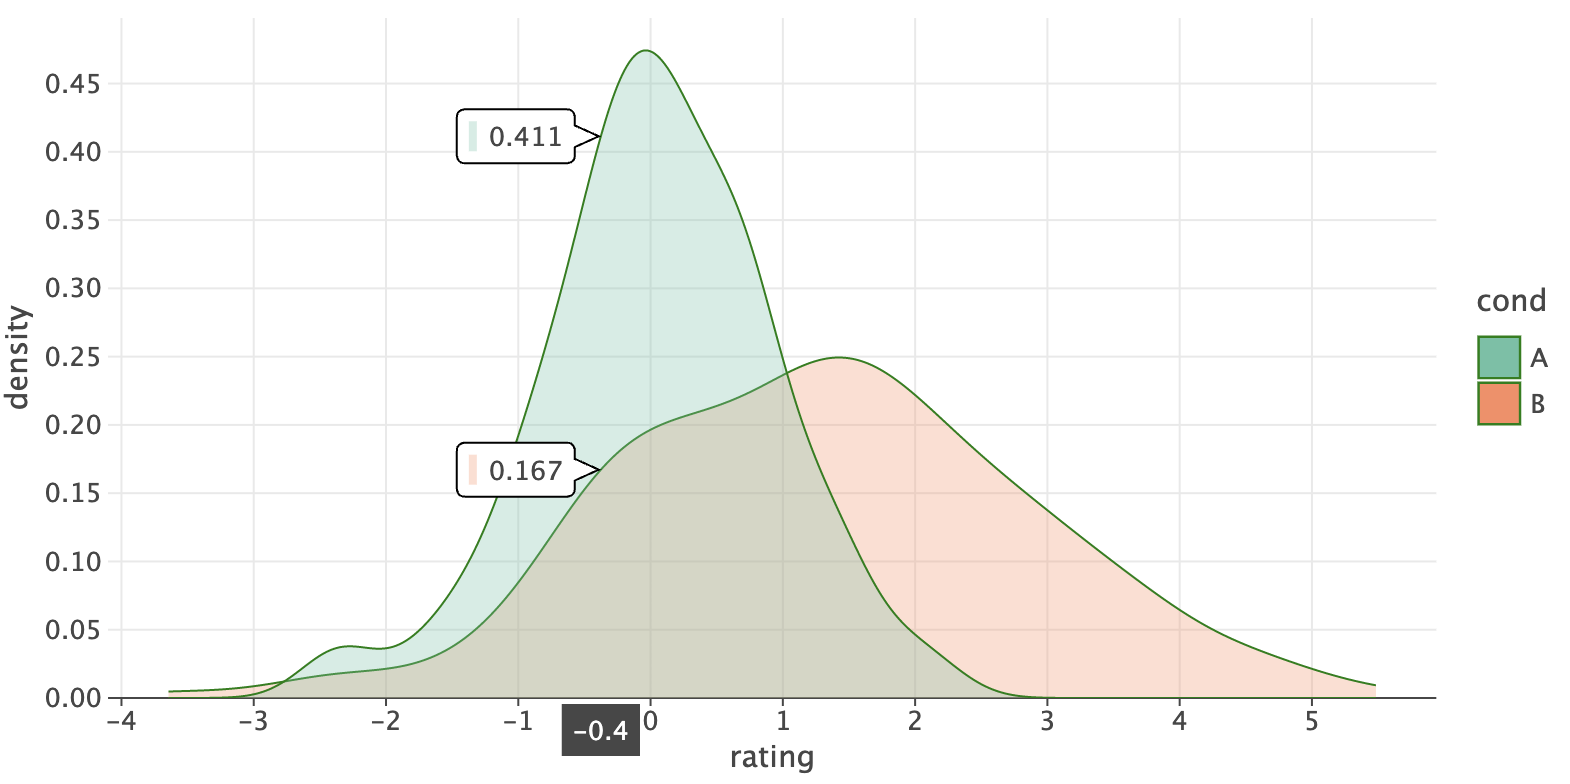
See the "Quickstart" notebook in Datalore or Jupyter nbviewer.
- Usage
- Documentation
- What is new in 4.13.0
- Recent Updates in the Gallery
- Change Log
- Code of Conduct
- License
With the help of Lets-Plot Kotlin API you can easily create plots in Kotlin Notebook, Datalore, Jupyter with Kotlin Kernel
or any other notebook that supports Kotlin Kernel.
%use lets-plot This "line magic" will apply Lets-Plot library descriptor which adds to your notebook all the boilerplate code necessary to create plots.
By default, library descriptor is bundled with the Kotlin Jupyter Kernel installed in your environment.
However, you can override the default settings using:
%useLatestDescriptors In this case the latest library descriptor will be pulled from the Kotlin Jupyter Libraries repository.
%use lets-plot(v=4.13.0, isolatedFrame=false, output="js, ktnb, svg") -
v- version of the Lets-Plot Kotlin API. -
isolatedFrame- Iffalse: load JS just once per notebook (default in Jupyter).
Iftrue: include Lets-Plot JS in each output (default in Datalore notebooks). -
output- comma-separated list of output types to store in notebook cells (default:"js, ktnb, svg"). \
Available types:js- Classic Web output: HTML+JSktnb- Kotlin Notebook Swing-based renderingsvg- Static SVG outputpng- Static PNG output
Note: Static images (SVG/PNG) are hidden when
jsorktnboutputs are present, and only displayed in environments where JavaScript is not executed (e.g., GitHub).This option can be helpful when file size becomes a problem. For example, storing only static output (SVG or PNG) can significantly reduce file size when working with large datasets where plot interactivity is not a priority.
To learn how to embed Lets-Plot charts in Compose Multiplatform applications, please check out the Lets-Plot Compose Frontend project at GitHub.
To learn more about creating plots in JVM or Kotlin/JS environment, please read USAGE_JVM_JS.md.
Examples of using the Lets-Plot Kotlin API in JVM and Kotlin/JS applications are available in the Lets-Plot Kotlin Mini Apps (Demos) GitHub repository.
-
Lets-Plot Kotlin API documentation and API reference: Lets-Plot for Kotlin
-
A quick introduction to the Grammar of Graphics and Lets-Plot Kotlin API: Lets-Plot Usage Guide
Kotlin: v2.2.20 (was v1.9.25).
Important
Artifact changes in the core Lets-Plot library (v4.9.0):
- New artifact for JVM Swing applications:
org.jetbrains.lets-plot:lets-plot-swing. This artifact provides theSwingPlotPanelclass, which can be used to display plots in Swing applications instead of the now-obsoleteDefaultPlotPanelBatik. For details, see the jvm-swing-app example in the "lets-plot-mini-apps" repository. - [BREAKING]: Removed JavaFX artifacts. The
org.jetbrains.lets-plot:lets-plot-jfxartifact is no longer available. Replace it with neworg.jetbrains.lets-plot:lets-plot-swingdependency and useSwingPlotPanelinstead ofDefaultPlotPanelJfx. For details, see the jvm-javafx-app example in the "lets-plot-mini-apps" repository. - [BREAKING]: Removed
plot-image-exportmodule. Theorg.jetbrains.lets-plot:lets-plot-image-exportartifact is no longer available. ThePlotImageExportutility has been moved to theplatf-awtmodule:org.jetbrains.letsPlot.awt.plot.PlotImageExport. The requiredorg.jetbrains.lets-plot:platf-awtdependency is likely already present in your project.
-
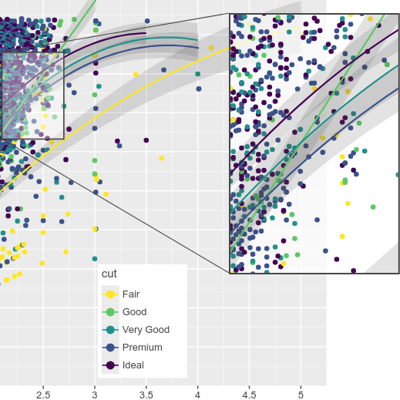
Statistical Summaries Directly on
geomSmooth()Plot LayerThe
geomSmooth()layer now includes alabelsparameter designed to display statistical summaries of the fitted model directly on the plot.
This parameter accepts asmoothLabels()object, which provides access to model-specific variables like$R^2$ and the regression equation.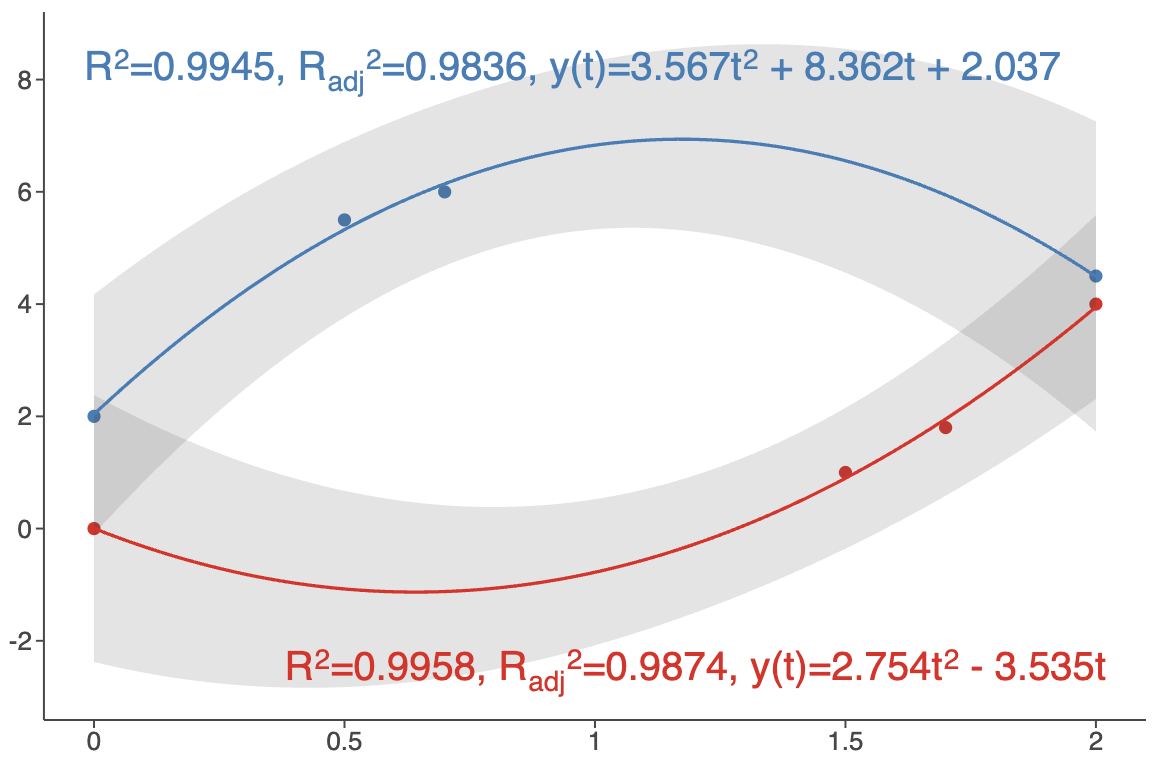
See: example notebook.
-
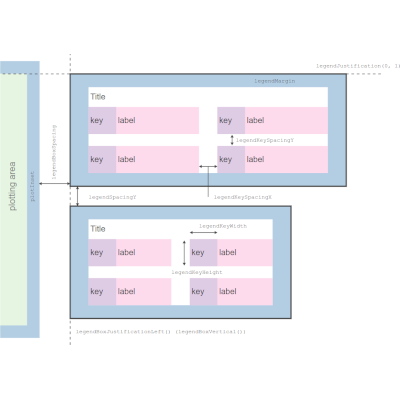
Plot Tags
Plot tags are short labels attached to a plot.

See: example notebook and updated Plot Layout Diagrams.
-
New
geomBracket()andgeomBracketDodge()GeometriesNew geometries designed primarily for significance bars (p-values) annotations in categorical plots.
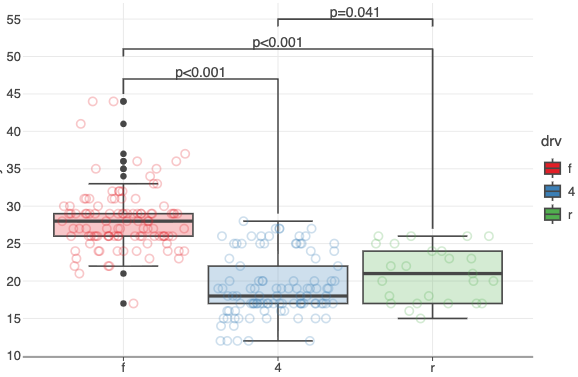
See: example notebook.
-
Custom Color Palettes in
geomImshow()The
cmapparameter now allows you to specify a list of hex color codes for visualizing grayscale images.
Also, the newcguideparameter lets you customize the colorbar for grayscale images.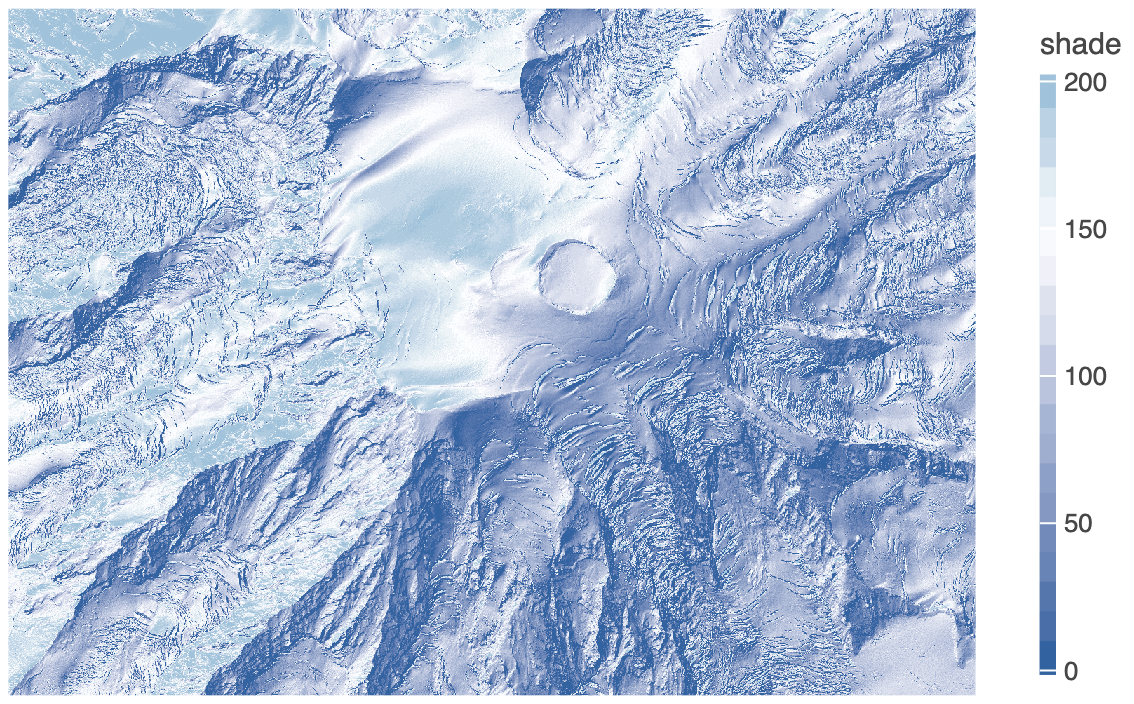
See: example notebook.
-
New
palette()Method in Color ScalesGenerates a list of hex color codes that can be used with
scaleColorManual()to maintain consistent colors across multiple plots.See: example notebook.
-
New
overflowparameter inscaleColorBrewer(),scaleFillBrewer()Controls how colors are generated when more colors are needed than the palette provides.
Options:'interpolate'('i'),'cycle'('c'),'generate'('g').See: example notebook.
-
New
breakWidthParameter in Positional ScalesSpecifies a fixed distance between axis breaks.
See examples:
-
Axis Minor Ticks Customization
The
axisMinorTicksandaxisMinorTicksLengthparameters intheme().See: example notebook.
-
Pan/Zoom in
gggrid()with Shared AxesPan/Zoom now propagates across subplots with shared axes (
sharex/sharey).See: example notebook.
-
And More
See CHANGELOG.md for a full list of changes.
Recent Updates in the Gallery
See CHANGELOG.md.
This project and the corresponding community are governed by the JetBrains Open Source and Community Code of Conduct. Please make sure you read it.
Code and documentation released under the MIT license. Copyright © 2019-2025, JetBrains s.r.o.