edited tags
Source Link
Alexey Popkov
  • 62.5k
  • 7
  • 163
  • 405

I have discrete optical spectra data consisting of pairs of wavelengths and intensities, and I would like to make a ListPlot in which the points are both joined, and colored according to the wavelength as is the filling.

Here is an example.

Here's fake data that illustrates the problem:

ListPlot[ Table[Style[{λ, Sin[λ/400]}, ColorData["VisibleSpectrum"][λ]], {λ, 400, 700, 5}], PlotStyle -> PointSize[Medium], Filling -> Axis, FillingStyle -> Function[{λ, y}, ColorData["VisibleSpectrum"][#[[1]] &]]] 

I can get the points to be properly colored, but not the filling. Moreover, the ideal is to have a continuous filling underneath curve (as in the linked example), i.e., not discrete bars. I've tried numerous variations on the FillingStyleFillingStyle, without success.

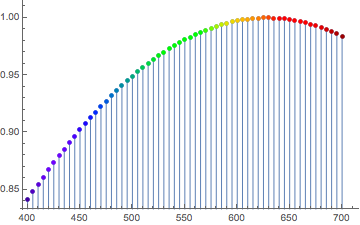
enter image description here

I have discrete optical spectra data consisting of pairs of wavelengths and intensities, and I would like to make a ListPlot in which the points are both joined, and colored according to the wavelength as is the filling.

Here is an example.

Here's fake data that illustrates the problem:

ListPlot[ Table[Style[{λ, Sin[λ/400]}, ColorData["VisibleSpectrum"][λ]], {λ, 400, 700, 5}], PlotStyle -> PointSize[Medium], Filling -> Axis, FillingStyle -> Function[{λ, y}, ColorData["VisibleSpectrum"][#[[1]] &]]] 

I can get the points to be properly colored, but not the filling. Moreover, the ideal is to have a continuous filling underneath curve (as in the linked example), i.e., not discrete bars. I've tried numerous variations on the FillingStyle, without success.

enter image description here

Source Link
David G. Stork
  • 43k
  • 3
  • 40
  • 110

Filling a ListPlot with an optical spectrum

I have discrete optical spectra data consisting of pairs of wavelengths and intensities, and I would like to make a ListPlot in which the points are both joined, and colored according to the wavelength as is the filling.

Here is an example.

Here's fake data that illustrates the problem:

ListPlot[ Table[Style[{λ, Sin[λ/400]}, ColorData["VisibleSpectrum"][λ]], {λ, 400, 700, 5}], PlotStyle -> PointSize[Medium], Filling -> Axis, FillingStyle -> Function[{λ, y}, ColorData["VisibleSpectrum"][#[[1]] &]]] 

I can get the points to be properly colored, but not the filling. Moreover, the ideal is to have a continuous filling underneath curve (as in the linked example), i.e., not discrete bars. I've tried numerous variations on the FillingStyle, without success.

enter image description here