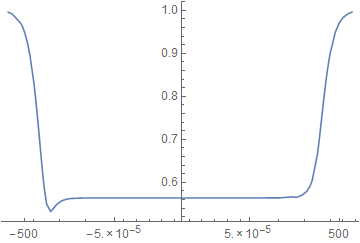
According to the comment below your question I believe this does what you want:
scale = Sign[#] Log[1 + Abs@#] &; invscale = Sign[#] (Exp[Abs@#] - 1) &; ListLinePlot[ llvaluefull, ScalingFunctions -> {{scale, invscale}, Identity} ] 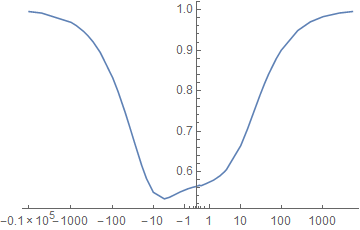
ScalingFunctions works in ListLinePlot in Mathematica 10.0.2, but it is not officially supported. It may not work in earlier versions.
Adapting the code I used for How do I make a log plot where the plot is logarithmic in the distance from the X-Axis (including negative values)?How do I make a log plot where the plot is logarithmic in the distance from the X-Axis (including negative values)? you can arbitrarily zoom the zero region with:
logify[_][x_ /; x == 0] := 0 logify[off_][x_] := Sign[x] Max[0, (off + Re@Log@x)/off] inverse[off_][x_] := Sign[x] Exp[(Abs[x] - 1) off] logscale[n_] := {logify[n], inverse[n]} Examples:
ListLinePlot[llvaluefull, ScalingFunctions -> {logscale[1], Identity}] 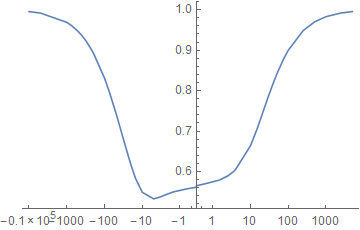
With logscale[7]:
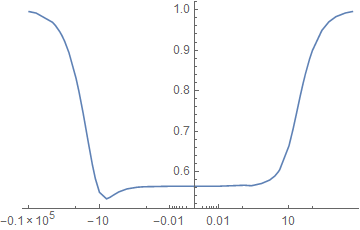
With logscale[22]: