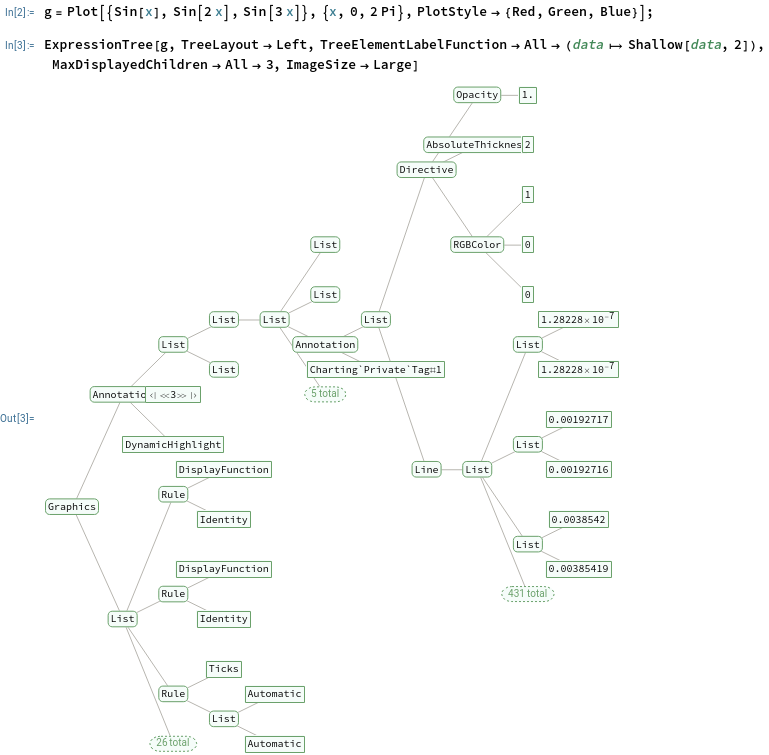
One recurrent problem I'm having with displays generated with TreeForm is that the expressions to be so displayed often at least one level with many (> 20) nodes at, which results in many overlapping labels that obscure each other.1
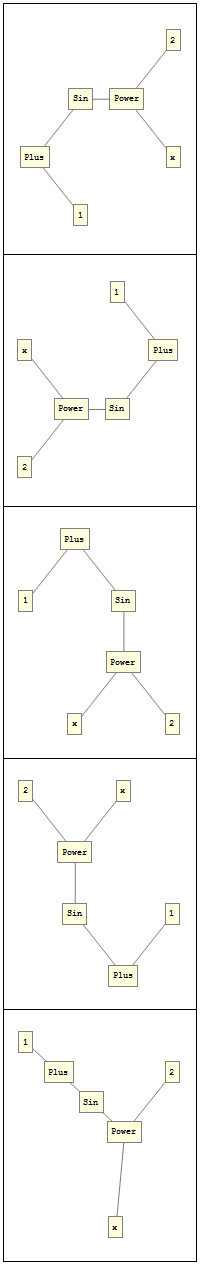
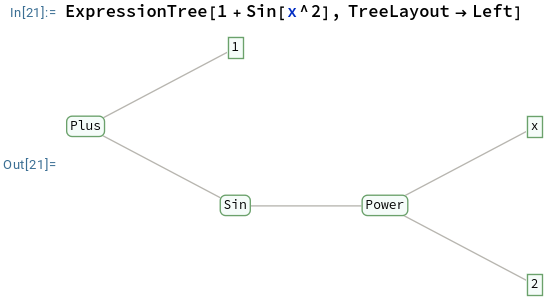
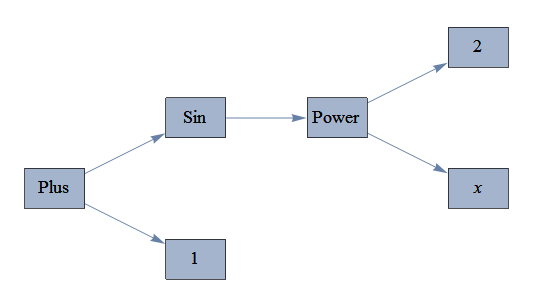
One simple way to mitigate the problem would be to display the same tree "sideways" (i.e., rotated 90 degrees, as would be the case if the display had been generated by a TreePlot command with the Left orientation parameter, for example). Of course, for this strategy to be at all useful, it is necessary that only the geometrical arrangement of the nodes and edges be rotated, not the labels. The latter should remain in the standard "horizontal"/left-to-right/text orientation.
I'm stymied by the fact that the output of TreeForm only looks like a Graphics object, but isn't really one. Is there a way to get Mathematica to return the Graphics object corresponding to the displayed image? Better yet would be to get the equivalent TreePlot command.
EDIT:
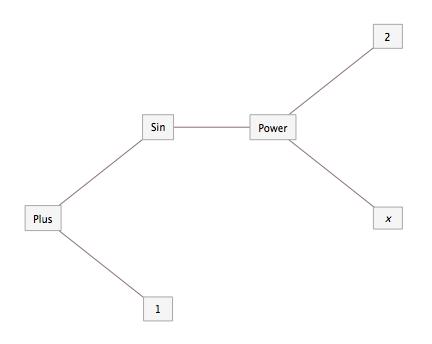
1 For example, the following shows the kind of tree I'm trying to work with:
g = Plot[{Sin[x], Sin[2 x], Sin[3 x]}, {x, 0, 2 Pi}, PlotStyle -> {Red, Green, Blue}]; TreeForm[g /. x_ /; And @@ NumericQ /@ x :> x[[0]] /. x_[List] :> x] 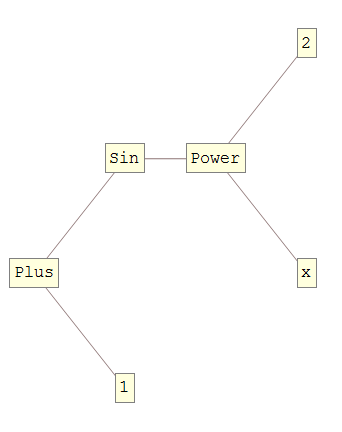
Graphicsobject, but isn't really one."? It is made up of graphics primitives... Did you mean to say it looks like aGraphobject, but isn't one? $\endgroup$TreeForm[x+y], and then runFullForm[%], what I get isPlus[x, y], and notGraphics[...]. This suggests thatTreeFormdoes not really produce aGraphicsobject, but is merely a display directive... Again, I may not be interpreting what I'm seeing correctly... $\endgroup$