3
$\begingroup$

enter image description here

i have a data as x and y table and i want to produce a curve showing me all points with zoom if possible , i used listplot[] as shown below :

ListPlot[{c, d, e, f, h, g, x, y(,s)}, Joined -> True, PlotLegends -> {"F" , "M", "MB", "p", "S", "L", "LB", "PS", "E"}, PlotRange -> All, AspectRatio -> 1/GoldenRatio];

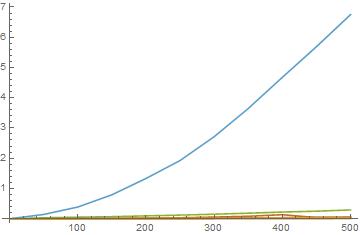
the graph was not clear for the values of y-axis
for example if c has values at 6 and {d,e,f,g,x} has values at 1 or 1.5,0.5 ,0.01 and 2
the curves obtains all on the axis except c

$\endgroup$
1
  • 2
    $\begingroup$ You will get help, provided you place your code in the Mathematica form, and give the data to enable one to reproduce your result. You can go to help/Tour at the top of the page to learn, how to do that. It would be further helpful, if you give a sketch (it might be e.g., a hand-drawn one) of what do you want to achieve. $\endgroup$ Commented Jan 3, 2017 at 12:20

1 Answer 1

3
$\begingroup$

Mathematica has build-in zoom for 3D. but for 2D, you'd have to make your own (as far as I know). Here is very basic example:

enter image description here

Manipulate[ Plot[Sin[x], {x, from, to}, GridLines -> Automatic, GridLinesStyle -> LightGray], {{from, -2 Pi, "from?"}, -2 Pi, 0, .1}, {{to, 2 Pi, "to?"}, 0, 2 Pi, .1} ] 

For more advanced example, see how-to-zoom-and-pan-a-listlineplot and zoom-in-on-a-2d-graph

$\endgroup$

Start asking to get answers

Find the answer to your question by asking.

Ask question

Explore related questions

See similar questions with these tags.