So here's some stuff to get you started:
We'll start with a more general candle image function:
candle[width : _Integer : 5, heightFactor : _Real : 1][{start_, end_, x_: 0}] := candle[{start, end, x}, width, heightFactor]; candle[{start_, end_, x_: 0}, width : _Integer : 5, heightFactor : _Real : 1. ] := Graphics[ { Blue, Line[{{x, end}, {x, start}}], If[start < end, { Rectangle[ {x - width/2, end + Min@{100, .1*(start - end)}}, {x + width/2, start - Min@{100, .1*(start - end)}} ] }, { EdgeForm@Directive[Thin, Blue], FaceForm@White, Rectangle[ {x - width/2, start + Min@{100, .1*(end - start)}}, {x + width/2, end - Min@{100, .1*(end - start)}} ] } ] }, PlotRange -> {{x - width/2, x + width/2}, Min@{start, end} + {0, Abs[heightFactor*(start - end)]}}, ImageSize -> {width, Abs[heightFactor*(start - end)]}, AspectRatio -> Abs[heightFactor*(start - end)/width] ]
Pull a test dataset out of what you provided:
ds = First /@ Values@g1;
Make a function for plotting these candles (we'll see why later):
candlePlot[k_: 10] := Show[ MapIndexed[ candle[Join[##], IntegerPart@k, 2.] &, Partition[Riffle[ds, Append[Rest@ds, Last@ds]], 2] ], PlotRange -> {{1, Length@ds}, MinMax@ds}, ImageSize -> {450, 300}, AspectRatio -> Full ];
Get a moving average line:
linePlot = ListLinePlot[ MovingAverage[ds, 10], PlotStyle -> Directive[Thickness[.002], Red] ];
Now is where our possible paths branch:
That candlePlot is pretty fast, but not blazing fast, so we can provide a faster version of it as a single line for our dynamic edits:
candlePlotFast = ListLinePlot[ ds, PlotStyle -> Directive[Thickness[.01], Blue] ];
Then combine these for a slow and fast version:
slowPlot = Show[ candlePlot, linePlot, ImageSize -> {450, 300}, AspectRatio -> Full ]; fastPlot = Show[ candlePlotFast, linePlot, ImageSize -> {450, 300}, AspectRatio -> Full ];
Then we'll just stick this all together with appropriate axis scaling and shifting (plus that line drawing thing you wanted):
DynamicModule[{ basePlot = slowPlot, slowPlot = slowPlot, fastPlot =(*slowPlot*)fastPlot, yshift = 0, xshift = 0, rescaleCandlePlot, lines = {}, tmpPos, tmpLine = Graphics[], xrange, yrange, mouseCoords }, {xrange, yrange} = PlotRange@basePlot; mouseCoords = Replace[MousePosition["GraphicsScaled"], { {x_, y_} :> { Rescale[x, {0, 1}, xshift + xrange], Rescale[y, {0, 1}, yshift + yrange] } }] &; " Note that we're just going off of the xrange scaling. I'm using the /160 factor because a width of 5 looked nice with 805 \ points initially. "; rescaleCandlePlot[] := ( slowPlot = Show[ candlePlot[Max@{Abs[#[[1]] - #[[2]]]/160, 1.} &@xrange], linePlot, ImageSize -> {450, 300}, AspectRatio -> Full ] ); Grid@{ { EventHandler[ Dynamic@ Show[ basePlot, tmpLine, Graphics[{Pink, lines}], ImageSize -> {450, 300}, Axes -> True, AspectRatio -> Full, PlotRange -> {xshift + xrange, yshift + yrange}, AxesOrigin -> First /@ {xshift + xrange, yshift + yrange} ], { "MouseDown" :> With[{p = mouseCoords[] }, tmpLine = Graphics[]; If[NumberQ /@ p, tmpPos = p, tmpPos = None ] ], "MouseDragged" :> (basePlot = fastPlot; With[{line = { If[Not@ValueQ@tmpPos, tmpPos = mouseCoords[], tmpPos], mouseCoords[] } }, If[AllTrue[line, AllTrue[NumericQ]], tmpLine = Graphics@Line@line, tmpLine = Graphics[] ] ] ), "MouseUp" :> With[{line = { If[Not@ValueQ@tmpPos, tmpPos = mouseCoords[], tmpPos], mouseCoords[] } }, basePlot = slowPlot; tmpLine = Graphics[]; tmpPos =.; If[AllTrue[line, AllTrue[NumericQ]], AppendTo[lines, Line@line] ] ] } ], IntervalSlider[ Dynamic[yrange, { basePlot = fastPlot; &, yrange = #; &, basePlot = slowPlot; & }], yrange, Appearance -> "Vertical"], Slider[ Dynamic[yshift, { basePlot = fastPlot; &, yshift = #; &, basePlot = slowPlot; & }], {-1, 1}*Abs[#[[2]] - #[[1]]] &@yrange, Appearance -> "Vertical" ]}, {IntervalSlider[ Dynamic[xrange, { basePlot = fastPlot; &, xrange = #; &, ( rescaleCandlePlot[]; basePlot = slowPlot; ) & }], xrange] }, {Slider[ Dynamic[xshift, { basePlot = fastPlot; &, xshift = #; &, basePlot = slowPlot; & }], {-1, 1}*Abs[#[[2]] - #[[1]]] &@xrange ]}, {, Button["Print Trend Lines", Print@lines ]} } ]
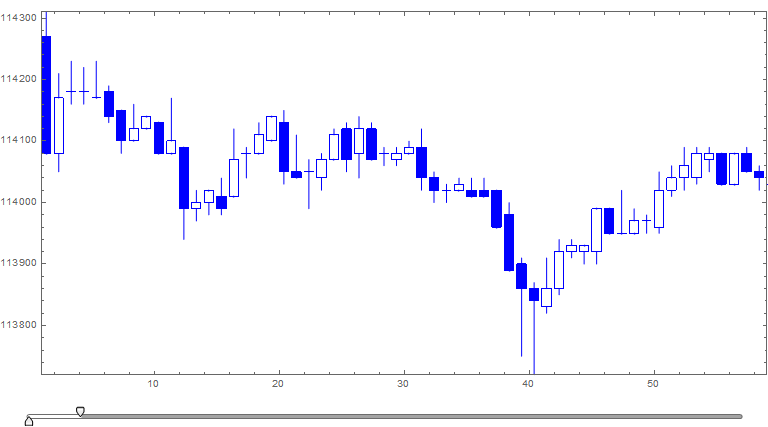
By changing the candle width when the xrange changes we can ensure a consistent candle appearance.
Note that you can improve the quality here by changing that fastPlot assignment in the DynamicModule initialization to slowPlot (the commented out one). It'll look a better, but will be much slower to shift and draw.
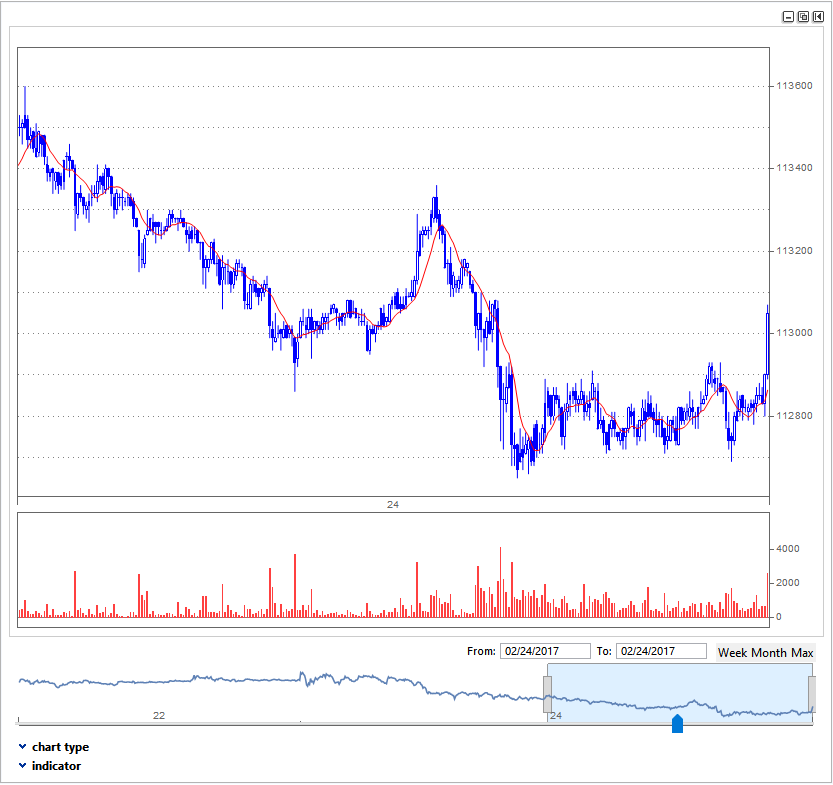
Looks like this in the end (where I've done some x-shifting and scaling and drawn a trend line):
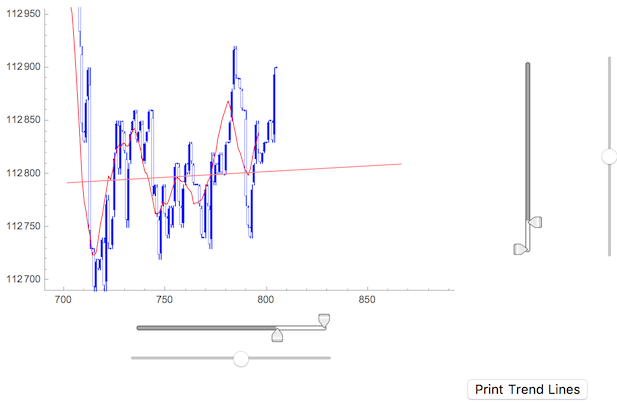
Obviously this is in no means a perfect drop in for the thing you wanted, but it shows you how to go about it I think.
And if you, like Kuba, don't want to copy all of those sections, here's all the code at once:
candle[width : _Integer : 5, heightFactor : _Real : 1][{start_, end_, x_: 0}] := candle[{start, end, x}, width, heightFactor]; candle[{start_, end_, x_: 0}, width : _Integer : 5, heightFactor : _Real : 1. ] := Graphics[ { Blue, Line[{{x, end}, {x, start}}], If[start < end, { Rectangle[ {x - width/2, end + Min@{100, .1*(start - end)}}, {x + width/2, start - Min@{100, .1*(start - end)}} ] }, { EdgeForm@Directive[Thin, Blue], FaceForm@White, Rectangle[ {x - width/2, start + Min@{100, .1*(end - start)}}, {x + width/2, end - Min@{100, .1*(end - start)}} ] } ] }, PlotRange -> {{x - width/2, x + width/2}, Min@{start, end} + {0, Abs[heightFactor*(start - end)]}}, ImageSize -> {width, Abs[heightFactor*(start - end)]}, AspectRatio -> Abs[heightFactor*(start - end)/width] ] ds = First /@ Values@g1; candlePlot[k_: 10] := Show[ MapIndexed[ candle[Join[##], IntegerPart@k, 2.] &, Partition[Riffle[ds, Append[Rest@ds, Last@ds]], 2] ], PlotRange -> {{1, Length@ds}, MinMax@ds}, ImageSize -> {450, 300}, AspectRatio -> Full ]; candlePlotFast = ListLinePlot[ ds, PlotStyle -> Directive[Thickness[.01], Blue] ]; linePlot = ListLinePlot[ MovingAverage[ds, 10], PlotStyle -> Directive[Thickness[.002], Red] ]; slowPlot = Show[ candlePlot[], linePlot, ImageSize -> {450, 300}, AspectRatio -> Full ]; fastPlot = Show[ candlePlotFast, linePlot, ImageSize -> {450, 300}, AspectRatio -> Full ]; DynamicModule[{ basePlot = slowPlot, slowPlot = slowPlot, fastPlot =(*slowPlot*)fastPlot, yshift = 0, xshift = 0, rescaleCandlePlot, lines = {}, tmpPos, tmpLine = Graphics[], xrange, yrange, mouseCoords }, {xrange, yrange} = PlotRange@basePlot; mouseCoords = Replace[MousePosition["GraphicsScaled"], { {x_, y_} :> { Rescale[x, {0, 1}, xshift + xrange], Rescale[y, {0, 1}, yshift + yrange] } }] &; " Note that we're just going off of the xrange scaling. I'm using the /160 factor because a width of 5 looked nice with 805 \ points initially. "; rescaleCandlePlot[] := ( slowPlot = Show[ candlePlot[Max@{Abs[#[[1]] - #[[2]]]/160, 1.} &@xrange], linePlot, ImageSize -> {450, 300}, AspectRatio -> Full ] ); Grid@{ { EventHandler[ Dynamic@ Show[ basePlot, tmpLine, Graphics[{Pink, lines}], ImageSize -> {450, 300}, Axes -> True, AspectRatio -> Full, PlotRange -> {xshift + xrange, yshift + yrange}, AxesOrigin -> First /@ {xshift + xrange, yshift + yrange} ], { "MouseDown" :> With[{p = mouseCoords[] }, tmpLine = Graphics[]; If[NumberQ /@ p, tmpPos = p, tmpPos = None ] ], "MouseDragged" :> (basePlot = fastPlot; With[{line = { If[Not@ValueQ@tmpPos, tmpPos = mouseCoords[], tmpPos], mouseCoords[] } }, If[AllTrue[line, AllTrue[NumericQ]], tmpLine = Graphics@Line@line, tmpLine = Graphics[] ] ] ), "MouseUp" :> With[{line = { If[Not@ValueQ@tmpPos, tmpPos = mouseCoords[], tmpPos], mouseCoords[] } }, basePlot = slowPlot; tmpLine = Graphics[]; tmpPos =.; If[AllTrue[line, AllTrue[NumericQ]], AppendTo[lines, Line@line] ] ] } ], IntervalSlider[ Dynamic[yrange, { basePlot = fastPlot; &, yrange = #; &, basePlot = slowPlot; & }], yrange, Appearance -> "Vertical"], Slider[ Dynamic[yshift, { basePlot = fastPlot; &, yshift = #; &, basePlot = slowPlot; & }], {-1, 1}*Abs[#[[2]] - #[[1]]] &@yrange, Appearance -> "Vertical" ]}, {IntervalSlider[ Dynamic[xrange, { basePlot = fastPlot; &, xrange = #; &, ( rescaleCandlePlot[]; basePlot = slowPlot; ) & }], xrange] }, {Slider[ Dynamic[xshift, { basePlot = fastPlot; &, xshift = #; &, basePlot = slowPlot; & }], {-1, 1}*Abs[#[[2]] - #[[1]]] &@xrange ]}, {, Button["Print Trend Lines", Print@lines ]} } ]