1
$\begingroup$

I have a series data

data=Uncompress[ FromCharacterCode[Flatten[ImageData[Import["https://i.sstatic.net/ApipY.png"], "Byte"]]]]; 

We can show it

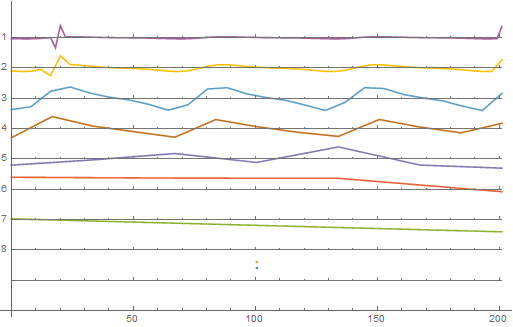
ListPlot[data, PlotRange -> All] 

Mathematica graphics

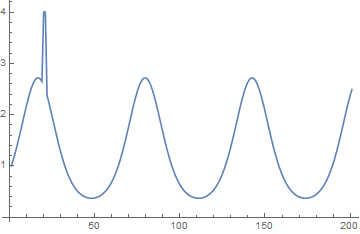
I put a singular value in position $20$ and $21$.As I know,wavelet analysis can detect it,but I don't know how to do it.

$\endgroup$

2 Answers 2

1
$\begingroup$

Of course expected more professionnel answer,I just dig in documentation

Firstly,plots wavelet transform coefficients

dwd = DiscreteWaveletTransform[data]; WaveletListPlot[dwd] 

Mathematica graphics

Select that basis index with minimal energy

{basisIndex} = Keys[MinimalBy[dwd["EnergyFraction"], Last]] 

{{0, 1}}

Ugly to extract that x-value.

MaximalBy[ Cases[basisIndex /. dwd["ListPlot"], a_Line :> a, Infinity][[1,1]], Abs@*Last] 

{{20.1, 1.00915}}

$\endgroup$
1
$\begingroup$

Simple way not using wavelet

Position[data - MedianFilter[data, 3], x_ /; x > 1] 

{{20}, {21}}

$\endgroup$
2
  • $\begingroup$ Thanks very much,but I have to say,it hard to find that threshold form those difference value $\endgroup$ Commented Sep 18, 2017 at 12:22
  • $\begingroup$ If you don't like picking an amplitude for the threshold, then just pick the Position of the largest (absolute) value of data-MedianFilter. $\endgroup$ Commented Sep 18, 2017 at 12:31

Start asking to get answers

Find the answer to your question by asking.

Ask question

Explore related questions

See similar questions with these tags.