4
$\begingroup$

I am currently trying to plot an implicit function of the form $f(x,y) = 0$ in mathematica.

The example I am using is $f(x,y) = y^4 - 730 y^2 + x^4 + 3y^2 x^2 - 675 x^2 + 729$

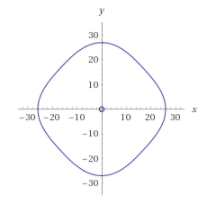
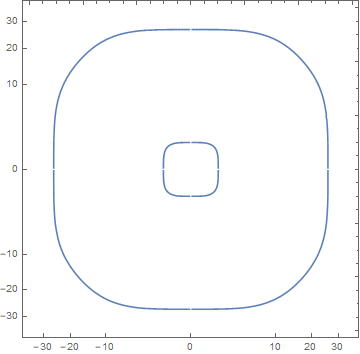
However the function has a small circle type shape at the origin and a another large circular shape around the origin:

enter image description here

This was plotted using the mathematica command:

ContourPlot[729 + x^4 + y^4 + 3 x^2 (-225 + y^2) == 730 y^2, {x, -32, 32}, {y, -34, 34}] 

Question: is there some way to make the plot so that the smaller circle becomes more visible?

$\endgroup$
1
  • $\begingroup$ This seems related: (18866) $\endgroup$ Commented Jul 29, 2017 at 11:37

3 Answers 3

4
$\begingroup$

Revising this answer I propose extracting contours from ContourPlot, converting to polar, scaling magnitude, then converting back and plotting. I will use code from ListLogLinearPlot for the whole real numbers:

logify[_][x_ /; x == 0] := 0 logify[off_][x_] := Sign[x] Max[0, (off + Re@Log@x)/off] inverse[off_][x_] := Sign[x] Exp[(Abs[x] - 1) off] logscale[n_] := {logify[n], inverse[n]} 

And an auxiliary function:

logTheta[m_][pts_] := FromPolarCoordinates /@ MapAt[logify[m], ToPolarCoordinates /@ pts, {All, 1}]; 

Now:

cp = ContourPlot[ 729 + x^4 + y^4 + 3 x^2 (-225 + y^2) == 730 y^2, {x, -32, 32}, {y, -34, 34}, MaxRecursion -> 3]; pts = Cases[Normal @ cp, Line[x_] :> x, -3]; ListLinePlot[logTheta[2] /@ pts , Ticks -> Charting`ScaledTicks @ logscale[2] , AspectRatio -> 1 ] 
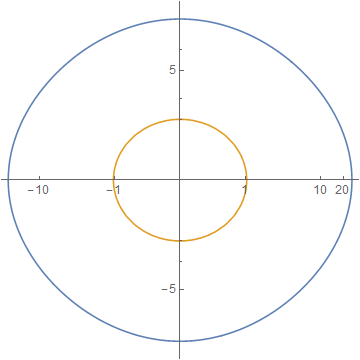
enter image description here

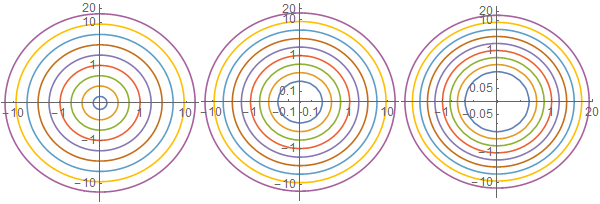
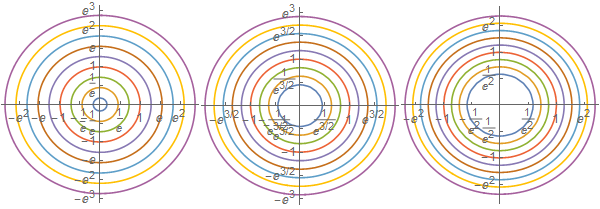
An additional example to better illustrate variable "zoom" in the scaling:

cp2 = ContourPlot[ Evaluate[x^2 + y^2 == # & /@ (3^Range[-3, 5])], {x, -16, 16}, {y, -16, 16}, PlotPoints -> 50] pts2 = Cases[Normal@cp2, Line[x_] :> x, -3]; ListLinePlot[logTheta[#] /@ pts2 , Ticks -> Charting`ScaledTicks @ logscale[#] , AspectRatio -> 1 ] & /@ {2, 3, 4} 
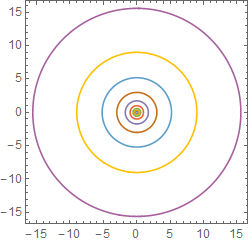
enter image description here

enter image description here

Beware: if the "zoom" is not enough you'll create singularities in the polar/Cartesian conversion and get errors instead of a plot:

logTheta[1] /@ pts2; 

FromPolarCoordinates::bdpt: Evaluation point {0,1.92728} is not a valid set of polar or hyperspherical coordinates. >>

I expect this will be a problem if you have contours that cross the origin, but I will have to come back to that later.

Controlling tick marks

Here is a way to "manually" generate a specification for Ticks or FrameTicks.

cp = ContourPlot[ 729 + x^4 + y^4 + 3 x^2 (-225 + y^2) == 730 y^2, {x, -32, 32}, {y, -34, 34}, MaxRecursion -> 3]; pts = Cases[Normal@cp, Line[x_] :> x, -3]; log = logTheta[2] /@ pts; ticks = {#, inverse[2][#]} & /@ FindDivisions[#, 11] & /@ CoordinateBounds[log]; ListLinePlot[log, Ticks -> ticks, AspectRatio -> 1] 
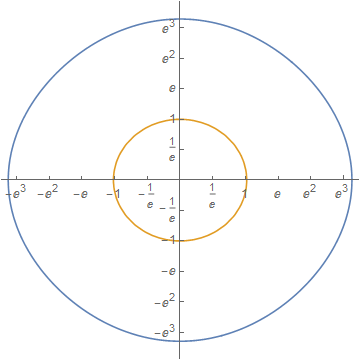
enter image description here

And for the additional example:

cp2 = ContourPlot[ Evaluate[x^2 + y^2 == # & /@ (3^Range[-3, 5])], {x, -16, 16}, {y, -16, 16}, PlotPoints -> 50] pts2 = Cases[Normal@cp2, Line[x_] :> x, -3]; Table[ log = logTheta[b] /@ pts2; ticks = {#, inverse[b][#]} & /@ FindDivisions[#, 11] & /@ CoordinateBounds[log]; ListLinePlot[log, Ticks -> ticks, AspectRatio -> 1, ImageSize -> 200], {b, {2, 3, 4}} ] // Row 
enter image description here

$\endgroup$
7
  • $\begingroup$ How would you add ticks back to these images? $\endgroup$ Commented Jul 30, 2017 at 10:45
  • $\begingroup$ For some reason when I copy this code, the ticks are not showing up on the image, do you perhaps know why this is? $\endgroup$ Commented Jul 30, 2017 at 11:25
  • $\begingroup$ @GrEg You're using the code with Ticks -> Charting`ScaledTicks @ logscale[2] right? I guess it's a version issue; which version of Mathematica are you using? I'll add code for "manual" tick generation later if I have time. $\endgroup$ Commented Jul 30, 2017 at 13:51
  • $\begingroup$ I am using the online version of mathematica from wolfram alpha. Yeah I am using that code. Thanks I would appreciate it! $\endgroup$ Commented Jul 30, 2017 at 14:31
  • $\begingroup$ I think the version is 11.1.1 $\endgroup$ Commented Jul 30, 2017 at 14:57
2
$\begingroup$

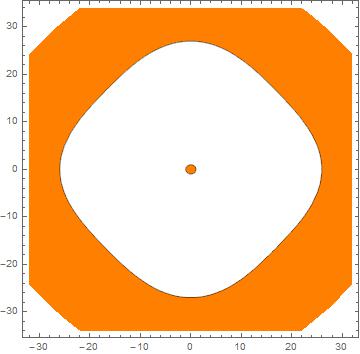
Maybe

ContourPlot[ 729 + x^4 + y^4 + 3 x^2 (-225 + y^2) - 730 y^2, {x, -32, 32}, {y, -34, 34}, Contours -> {{0}}, ContourShading -> {White, Orange}] 

enter image description here

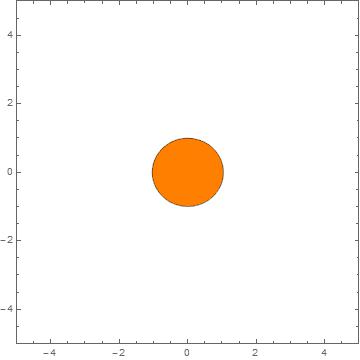
You can magnify the center circle by decreasing the PlotRange

r = 5; ContourPlot[ 729 + x^4 + y^4 + 3 x^2 (-225 + y^2) - 730 y^2, {x, -32, 32}, {y, -34, 34}, Contours -> {{0}}, ContourShading -> {White, Orange}, PlotPoints -> 50, PlotRange -> {{-r, r}, {-r, r}}] 

enter image description here

$\endgroup$
3
  • 2
    $\begingroup$ Thanks for the reply, I was thinking something more along the lines of changing the scales to a logarithmic scale, but I am not sure how to do this. $\endgroup$ Commented Jul 29, 2017 at 11:26
  • $\begingroup$ Is there no way of setting an 'axis scale'? $\endgroup$ Commented Jul 29, 2017 at 11:33
  • $\begingroup$ Not with ContourPlot or RegionPlot $\endgroup$ Commented Jul 29, 2017 at 11:38
1
$\begingroup$

You could rescale your variables with something like:

lhs[x_, y_] := 729 + x^4 + y^4 + 3 x^2 (-225 + y^2) rhs[y_] := 730 y^2 ticks = {#, #} &@{Table[{Sign[i] Sqrt[Abs[i]], i}, {i, -30, 30, 10}], Automatic}; 

Then

ContourPlot[lhs[Sign[x] x^2, Sign[y] y^2] == rhs[Sign[y] y^2], {x, -6, 6}, {y, -6, 6}, FrameTicks -> ticks] 

gives

enter image description here

$\endgroup$

Start asking to get answers

Find the answer to your question by asking.

Ask question

Explore related questions

See similar questions with these tags.