23
$\begingroup$

I'm creating figures (a T beam section) using the Graphics function. Like this:

a = Graphics[Polygon[{{0, 80}, {0, 85}, {100, 85}, {100, 80}}]]; b = Graphics[Polygon[{{47.5, 80}, {52.5, 80}, {52.5, 0}, {47.5, 0}}]]; Show[a, b] 

Which gives:

enter image description here

I need to insert numerical dimensions to its sizes. I need something like this:

enter image description here

How can i do that?

$\endgroup$
1
  • $\begingroup$ No SolidWorks é muito mais fácil. Só um comentário... $\endgroup$ Commented Nov 25, 2017 at 3:13

3 Answers 3

34
$\begingroup$

You could turn the dimensioning into a handy function:

ClearAll@dim; dim[{a_, b_}, label_String, d_] := Module[{n = Normalize[RotationTransform[π/2][b - a]], t = Arg[(b - a).{1, I}], r}, If[t > π/2, t -= π]; { Arrowheads[{-0.04, 0.04}], Arrow[{a + d n, b + d n}], Line[{a + 0.1 d n, a + d n}], Line[{b + 0.1 d n, b + d n}], Rotate[Text[label, (a + b)/2 + 1.2 d n, {0, 0}], t, (a + b)/2 + 1.2 d n] }]; 

An example:

Graphics[{ {Gray, Rectangle[{0, 0}, {5, 3}], Polygon[{{0, 3}, {5, 3}, {4, 5}, {1, 5}}]}, dim[{{0, 0}, {5, 0}}, "5 cm", -1], dim[{{5, 0}, {5, 3}}, "3 cm", -1], dim[{{5, 3}, {4, 5}}, "2.24 cm", -1], dim[{{1, 5}, {4, 5}}, "3 cm", 1], dim[{{0, 3}, {1, 5}}, "2.24 cm", 1], dim[{{0, 0}, {0, 3}}, "3 cm", 1] }] 

1

EDIT:

This seems to have garnered a bit of attention, so I might tidy up a couple of aspects.

ClearAll@dim; dim[{a_, b_}, d_, round_:1] := Module[{ n = Normalize[RotationTransform[π/2][b - a]], t = Arg[(b - a).{1, I}], text}, text = ToString@Round[Norm[a - b], round]; If[d < 0, text = "\n" <> text, text = text <> "\n"]; {Arrowheads[{-0.04, 0.04}], Arrow[{a + d n, b + d n}], Line[{a + 0.1 d n, a + d n}], Line[{b + 0.1 d n, b + d n}], Rotate[Text[text, (a + b)/2 + d n, {0, 0}], t, (a + b)/2 + d n]}]; 

This version has much better positioning of the labels. The previous version had a scale factor based on the distance $d$. The further out it was, the further away from the dimension line. This version uses a newline \n to position the text consistently across any distance.

This version also automatically calculates the distance for you, instead of a user supplied label. The distance can be optionally rounded to whatever accuracy required. One could chop, change and combine label generation as required.

An example with labels at various distances:

Graphics[{{Gray, Polygon[{{0, 0}, {500, 500}, {490, 510}, {-10, 10}}]}, dim[{{0, 0}, {100, 100}}, -75, 0.01], dim[{{100, 100}, {400, 400}}, -75, 0.01], dim[{{400, 400}, {500, 500}}, -75, 0.01], dim[{{0, 0}, {400, 400}}, -150, 0.1], dim[{{0, 0}, {500, 500}}, -225] }] 

2

$\endgroup$
14
$\begingroup$

Here is my attempt:

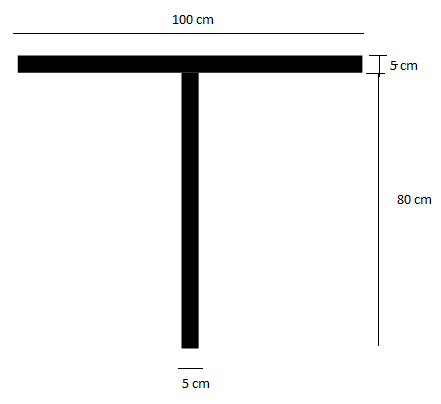
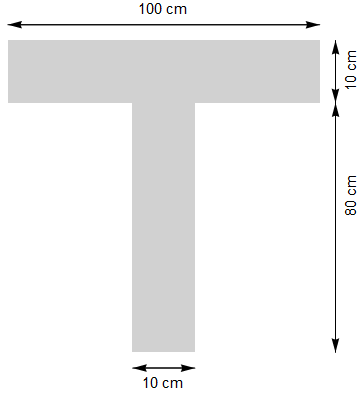
rectangles = Graphics[{GrayLevel[.4, .3], Rectangle[{0, 80}, {100, 100}], GrayLevel[.4, .3], Rectangle[{40, 0}, {60, 80}]}]; arrows = Graphics[{Arrow[{{40, -5}, {60, -5}}], Arrow[{{60, -5}, {40, -5}}], Arrow[{{105, 0}, {105, 80}}], Arrow[{{105, 80}, {105, 0}}], Arrow[{{105, 80}, {105, 100}}], Arrow[{{105, 100}, {105, 80}}], Arrow[{{0, 105}, {100, 105}}], Arrow[{{100, 105}, {0, 105}}]}]; text = Graphics[{Text[Style["10 cm", 15], {50, -10}], Text[Style["80 cm", 15], {110, 50}, {0, 0}, Automatic, {0, 1}], Text[Style["10 cm", 15], {110, 90}, {0, 0}, Automatic, {0, 1}], Text[Style["100 cm", 15], {50, 110}]}]; fig = Show[rectangles, arrows, text] 

enter image description here

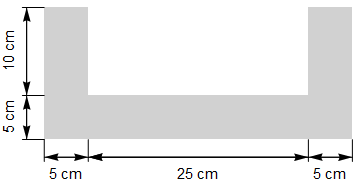
rectangles = Graphics[{GrayLevel[.4, .3], Rectangle[{0, 0}, {5, 15}], GrayLevel[.4, .3], Rectangle[{5, 0}, {30, 5}], GrayLevel[.4, .3], Rectangle[{30, 0}, {35, 15}]}]; lines = Graphics[{Line[{{0, 0}, {0, -2.5}}], Line[{{5, 0}, {5, -2.5}}], Line[{{30, 0}, {30, -2.5}}], Line[{{35, 0}, {35, -2.5}}], Line[{{0, 0}, {-2.5, 0}}], Line[{{0, 15}, {-2.5, 15}}], Line[{{0, 5}, {-2.5, 5}}]}]; arrows = Graphics[{Arrow[{{5, -2}, {30, -2}}], Arrow[{{30, -2}, {5, -2}}], Arrow[{{30, -2}, {5, -2}}], Arrow[{{0, -2}, {5, -2}}], Arrow[{{5, -2}, {0, -2}}], Arrow[{{30, -2}, {35, -2}}], Arrow[{{35, -2}, {30, -2}}], Arrow[{{-2, 0}, {-2, 5}}], Arrow[{{-2, 5}, {-2, 0}}], Arrow[{{-2, 5}, {-2, 15}}], Arrow[{{-2, 15}, {-2, 5}}]}]; text = Graphics[{Text[Style["5 cm", 15], {2.5, -4}], Text[Style["25 cm", 15], {17.5, -4}], Text[Style["5 cm", 15], {32.5, -4}], Text[Style["5 cm", 15], {-4, 2.5}, {0, 0}, Automatic, {0, 1}], Text[Style["10 cm", 15], {-4, 10}, {0, 0}, Automatic, {0, 1}] } ]; Show[rectangles, lines, arrows, text] 

enter image description here

$\endgroup$
5
$\begingroup$
Graphics[ {AbsoluteThickness[5], Line[{{0, 0}, {100, 0}}], Line[{{50, -80}, {50, 0}}], AbsoluteThickness[.5], Line[{{0, 5}, {100, 5}}], Text[Style["100 cm"], {50, 10}]}, PlotRange -> {{-10, 110}, {-110, 20}}] 

enter image description here

I'll let you put in the remaining annotation lines.

$\endgroup$

Start asking to get answers

Find the answer to your question by asking.

Ask question

Explore related questions

See similar questions with these tags.