6
$\begingroup$

I have such points

pts = Uncompress[FromCharacterCode[ Flatten[ImageData[Import["https://i.sstatic.net/zEP05.png"],"Byte"]]]]; ListPlot[pts] 

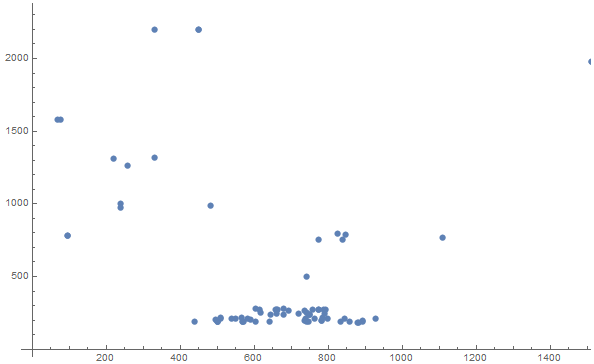
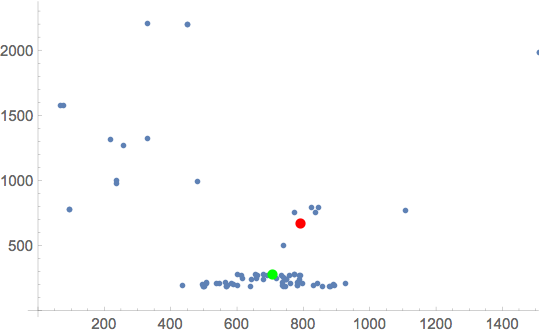
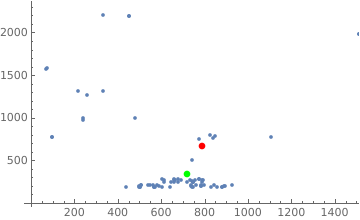
If I use the normal method to calculate the center point, it will be in the red area.

ListPlot[pts, Epilog -> {Red, PointSize[.02], Point[Mean[pts]]}] 

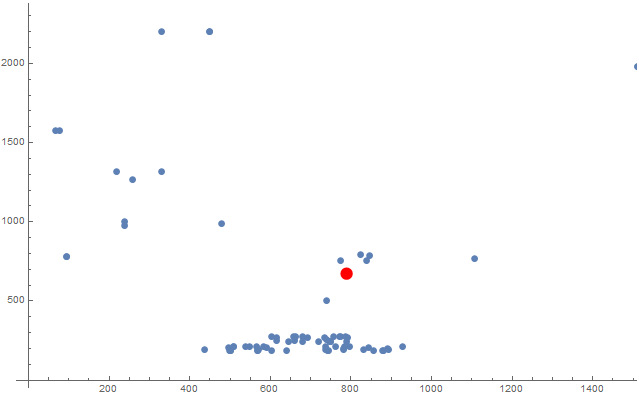
Now I want to calculate the specific "center" point. When the point in the denser area, it has greater weight. I think the "center" point I'm after should be at the bottom of that red point. But how to calculate it?

$\endgroup$

2 Answers 2

11
$\begingroup$

The median is known to be more robust against outliers than the mean:

ListPlot[pts, Epilog -> {Red, PointSize[.02], Point[Mean[pts]], Green, Point[SpatialMedian[pts]]}] 

enter image description here

have also a look on the other "Location Statistics" in this guide on descriptive statistics.

$\endgroup$
3
  • 1
    $\begingroup$ Note that SpatialMedian requires you to load the MultivariateStatistics package in versions of Mathematica before 11.1. Also note that the SpatialMedian does not calculate the "median" as the term is usually used. (I agree it's probably the simplest thing to get at what the OP is asking for, though.) $\endgroup$ Commented May 21, 2018 at 13:41
  • $\begingroup$ Median also work but it takes the median componentwise. This is however not rotationindependent. (But if the different axes have different scaling, this might not be a problem at all...) $\endgroup$ Commented May 21, 2018 at 13:51
  • 1
    $\begingroup$ +1 It should be mentioned that there are many many different types of medians for multivariate data because the univariate median doesn't generalize to higher dimensions. I only see "Median" and "SpatialMedian" implemented in MMA but there are others such as Oja's Simplex Median, Beach and the Halfspace Median, Simplical Depth Median, and Convex Hull Stripping Median. Each one has its own advantages, disadvantages, robustness, computational complexity, etc. $\endgroup$ Commented May 21, 2018 at 16:04
7
$\begingroup$

One possible way to operationalize the requirement "When the point in the denser area, it has greater weight" is to weight each point by the number of neighbors within a specified distance:

nf = Nearest[pts]; radius = 50; weightedData = WeightedData[pts, Length[nf[#, {All, radius}]] & /@ pts]; center = Mean[weightedData]; ListPlot[pts, Epilog -> {Red, PointSize[.02], Point[Mean[pts]], Green, Point @ center}] 

enter image description here

With radius = 100 we get

enter image description here

$\endgroup$

Start asking to get answers

Find the answer to your question by asking.

Ask question

Explore related questions

See similar questions with these tags.