I'm creating a fairly simple plot with a bunch of similar graphs in it. It looks something like this (but with more than two functions):
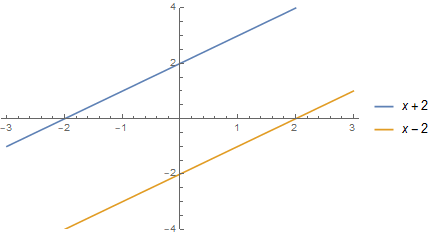
Plot[{x + 2, x - 2}, {x, -3, 3}, PlotRange -> {{-3.1, 3.1}, {-4, 4}}, PlotLegends -> "Expressions"] And it produces the following plot, as expected:
But I want each equation in the legend to say "$y=\ldots$", i.e. I want to produce the following:
Plot[{x + 2, x - 2}, {x, -3, 3}, PlotRange -> {{-3.1, 3.1}, {-4, 4}}, PlotLegends -> {"y=x+2", "y=x-2"}] 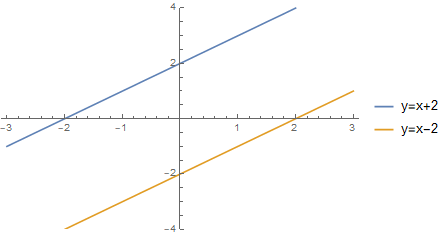
As you can see, I manually typed all equations into PlotLegends. But I don't want to do that, because in my actual application I have more than two functions on the same graph. Is it possible to still use "Expressions" in PlotLegends, but to somehow modify all of them at once, because I want to add "y=" to all of them?