4
$\begingroup$

I have a set of data that is in the form

{{\[Theta], \[Phi], r},....} 

Or to make it simpler:

data={{0, 0, 3.3102}, {0, 2, 3.3102}, ..., {10, 90, 4.084}} 

Alternatively, a data set can be generated by using:

data=Flatten[Table[{th,phi,RandomReal[100]},{th,0,45,2},{phi,0,90,2}],1]; 

Now I want to plot this data in a polar plot to get something equivalent to: Polar Plot of ion ranges in Al foil

Where the text in the picture referring to different crystal planes is not important. To generate a uniform density plot, there should be some interpolation between data points but I guess that is not necessary as I can always do that in preprocessing of the data points. Now this is somewhat easily generated by using python, however I am looking for a way to generate such a plot in mathematica in attempts to keep layout consistency between my other plots.

I can easily generate a ListDensityPlot using:

ListDensityPlot[data] 

That looks like (with some legends manipulation and graphics options tweaked to make it look "more presentable"): created by me

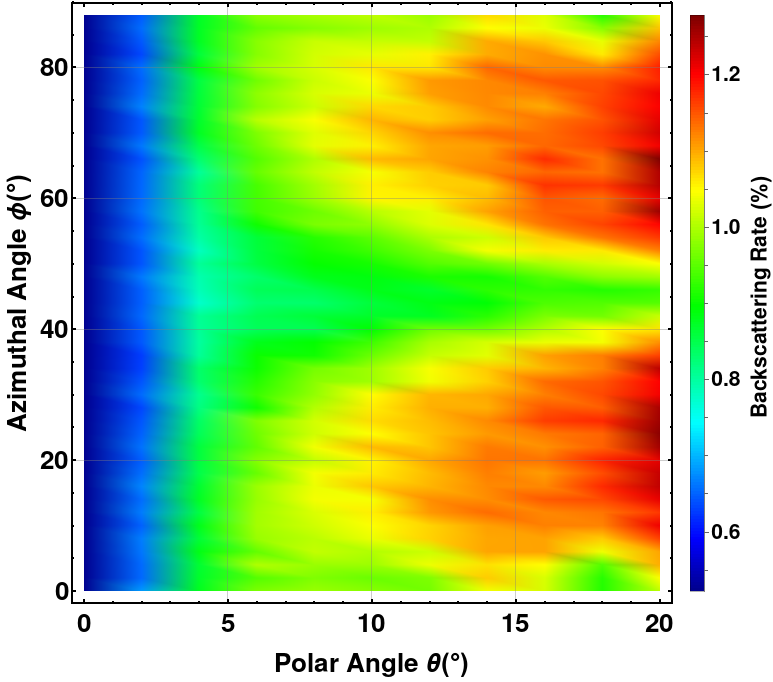
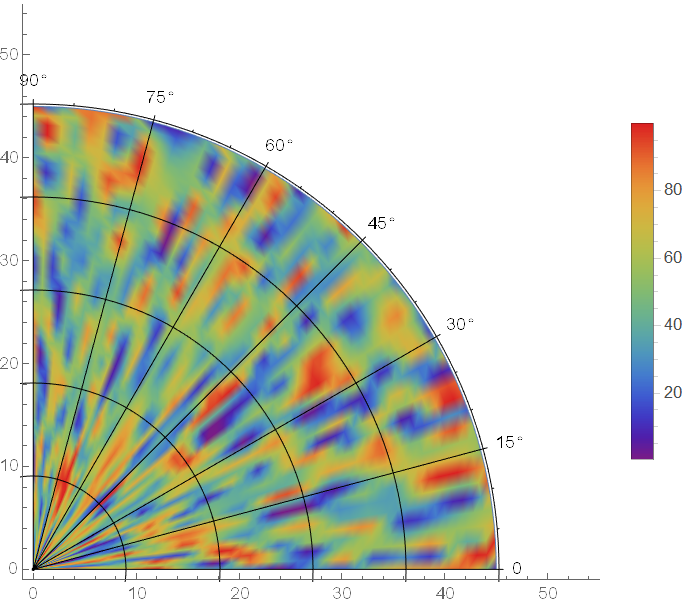
I managed to convert the rectangular plot to a circular one using transfromation of coordinates i.e.

N[{#[[1]] Cos[#[[2]]], #[[1]] Sin[#[[2]]], #[[3]]}] & /@data 

Not a 100% sure that this is correct to be honest, but I guess it is the right approach i.e. convert coordinates

But I still don't know how to add the grid lines properly, the custom legend i.e. Azimuthal Angle I guess I can always add afterwards by hand but it would be appreciated to add it while plotting too

$\endgroup$
4
  • $\begingroup$ If your data is really in the form {θ, ϕ, r}, where θ is polar angle and ϕ is azimuthal angle, then I don't think this can be visualized with polar heat map. Please notice the coordinates in polar coordinate system are radius and azimuth. Perhaps you're looking for ListSliceDensityPlot3D. $\endgroup$ Commented Sep 30, 2020 at 2:31
  • $\begingroup$ In theory my data can vary, r is just a place holder for range in the material or transmission rate through a foil or whatever. Whereas theta and phi are indeed the polar and azimuthal angle respectively. Basically what I am looking for is having a plot the same as in the first figure, where theta is on the x and y axis, the azimuthal on the curvature of the circle and r is just the density or heatmap. $\endgroup$ Commented Sep 30, 2020 at 8:18
  • $\begingroup$ Then this plot doesn't represent the real geometry, what's the benefit of visualizing the data in this way? $\endgroup$ Commented Sep 30, 2020 at 8:26
  • $\begingroup$ It becomes easier to highlight the crystallographic planes, and is visually easier to read. Also somewhat of a common practice in the community I guess. $\endgroup$ Commented Sep 30, 2020 at 8:49

1 Answer 1

4
$\begingroup$

Here's my trial:

SeedRandom[2020]; data = Flatten[Table[{th, phi, RandomReal[100]}, {th, 0, 45, 3}, {phi, 0, 90 Degree, 2 Degree}], 1]; func = Interpolation[data]; {{rmin, rmax}, {phimin, phimax}} = func["Domain"]; radian = 32; dphi = 15 Degree; Legended[ParametricPlot[r {Cos[phi], Sin[phi]}, {r, rmin, rmax}, {phi, phimin, phimax}, ColorFunction -> Function[{x, y, r, phi}, ColorData["Rainbow"]@Rescale[func[r, phi], MinMax@data[[All, 3]]]], ColorFunctionScaling -> False, PlotPoints -> 50, Frame -> {{True, False}, {True, False}}, PlotRangePadding -> {{1, 10}, {1, 10}}, PlotRange -> {{0, rmax}, {0, rmax}}]~Show~ PolarPlot[radian, {phi, phimin, phimax}, PolarAxes -> Automatic, PolarTicks -> {"Degrees", None}, PolarGridLines -> {Range[phimin, phimax, dphi], Automatic}, GridLinesStyle -> Black, PlotRange -> All, PlotStyle -> Transparent], BarLegend[{ColorData["Rainbow"]@Rescale[#, MinMax@data[[All, 3]]] &, MinMax@data[[All, 3]]}]] 

enter image description here

The main obstacle that stops me from creating a general-purpose function is, it's not clear how PolarPlot decides the position of PolarAxes. (I ended up with finding the radian = 32; by trial and error. )

$\endgroup$
1
  • $\begingroup$ thank you for the answer, it works perfectly apart from the caveat you mentioned. That I have to change on my overall range of the polar angles. Ah well can't have it all I guess but thanks a lot! $\endgroup$ Commented Sep 30, 2020 at 14:41

Start asking to get answers

Find the answer to your question by asking.

Ask question

Explore related questions

See similar questions with these tags.