g1 = GridGraph[{5, 5}]

We can use RotationTransform and GraphEmbedding to rotate the vertex coordinates of the input graph:
ClearAll[rotateVCoords] rotateVCoords[angle_: 30 Degree] := RotationTransform[angle, Mean @ #] @ # &[GraphEmbedding @ #] & SetProperty[g1, VertexCoordinates -> rotateVCoords[][g1]]
frames = Show[g1, SetProperty[g1, VertexCoordinates -> rotateVCoords[# Degree][g1]], PlotRange -> MinMax /@ Transpose[rotateVCoords[45 Degree][g1]], PlotRangePadding -> Scaled[.05]] & /@ Range[0, 360, 3]; Export["rotatevcoords.gif", frames, AnimationRepetitions -> ∞]
We can use rotateVCoords in two ways: (1) With Show + SetProperty to get a Graphics object, (2) With GraphUnion + IndexGraph to get a Graph object as output:
ClearAll[rotateAndCombineToGraphics, rotateAndCombineToGraph] rotateAndCombineToGraphics[angle_: 30 Degree] := Show[#, SetProperty[#, VertexCoordinates -> rotateVCoords[angle][#]]] & rotateAndCombineToGraph[angle_: 30 Degree] := GraphUnion[#, IndexGraph[#, 1 + VertexCount @ #], VertexCoordinates -> Join[GraphEmbedding @ #, rotateVCoords[angle][#]], ##2] &
Examples:
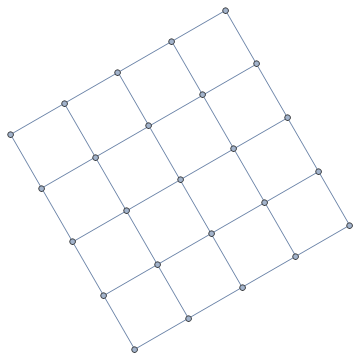
rotateAndCombineToGraphics[] @ g1
Head @ %
Graphics
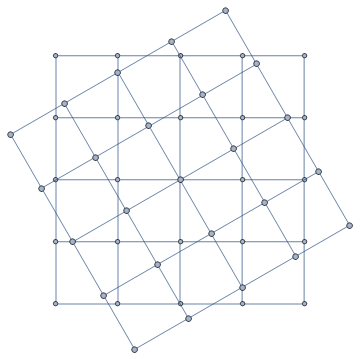
rotateAndCombineToGraph[] @ g1
Head @ %
Graph
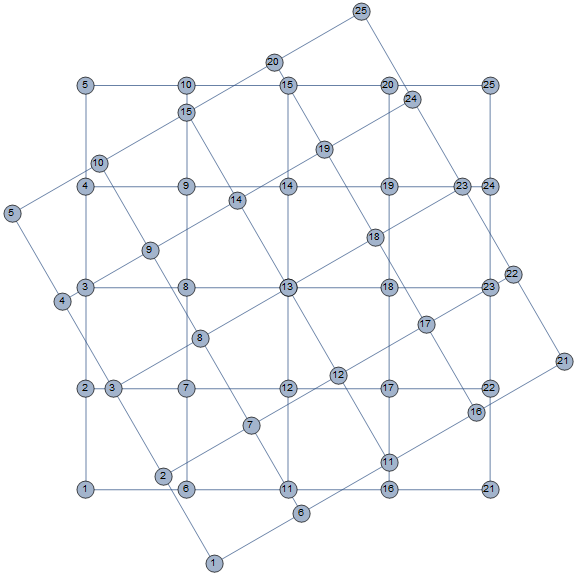
With the second approach, we can add Graph options:
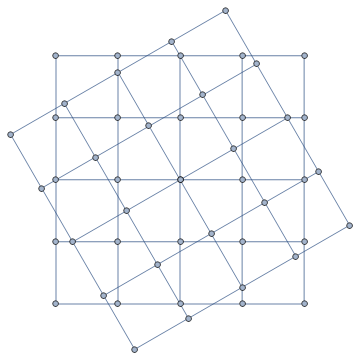
rotateAndCombineToGraph[][g1, ImageSize -> Large, VertexSize -> Scaled[.03], VertexLabels -> {v_ :> Placed[Mod[v, VertexCount[g1], 1], Center]}]
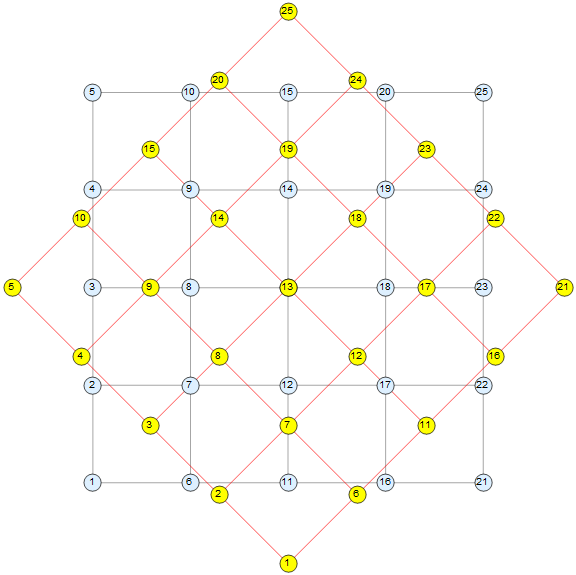
rotateAndCombineToGraph[45 Degree][g1, ImageSize -> Large, VertexSize -> Scaled[.03], VertexLabels -> {v_ :> Placed[Mod[v, VertexCount[g1], 1], Center]}, VertexStyle -> {v_ :> If[v > VertexCount[g1], Yellow, LightBlue]}, EdgeStyle -> {_ :> Red, Alternatives @@ EdgeList[g1] :> Gray}]

Overlay[{GridGraph[{5, 5}], Rotate[GridGraph[{5, 5}], 45 Degree]}, Alignment -> Center]I forgot to write Degree, so deleted the previous comment. $\endgroup$