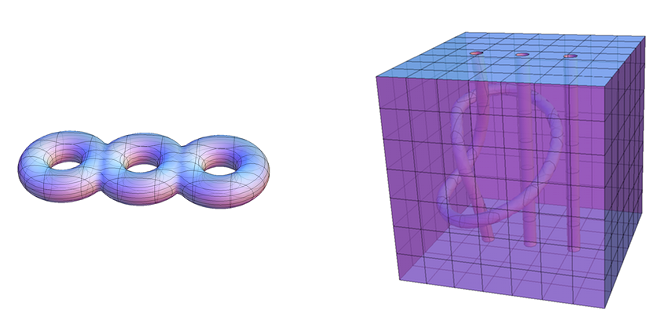
How to draw these two(especially the second one) graphs using Mathematica? The curve is not important.The point is how to dig some holes in a cube. BTW, These two shapes are Homotopy.
How to draw these two(especially the second one) graphs using Mathematica? The curve is not important.The point is how to dig some holes in a cube. BTW, These two shapes are Homotopy.
r = 1/40; sides = ParametricPlot3D[{ {0, u, v}, {1, u, v}, {u, 1, v}, {u,0,v} }, {u, 0, 1}, {v, 0, 1}, Mesh -> 7, PlotStyle -> { Directive[Purple, Opacity[0.6]], Directive[Purple, Opacity[0.6]], Directive[Purple, Opacity[0.6]], Directive[Purple, Opacity[0.2]] }, MeshStyle -> { Directive[Opacity[0.2]], Directive[Opacity[0.2]], Directive[Opacity[0.2]], Directive[Opacity[0.05]] }, Boxed -> False, Axes -> False]; topBot = ParametricPlot3D[{ {u, v, 1}, {u, v, 0} }, {u, 0, 1}, {v, 0, 1}, Mesh -> 7, PlotStyle -> Directive[Purple, Opacity[.4]], MeshStyle -> Opacity[0.2], Boxed -> False, Axes -> False, PlotPoints -> 55, RegionFunction -> Function[{u, v}, (u - 1/5)^2 + (v - 1/2)^2 > r^2 && (u - 1/2)^2 + (v - 1/2)^2 > r^2 && (u - 4/5)^2 + (v - 1/2)^2 > r^2]]; p[t_] = {0.1 (Cos[4 Pi*t] - 2 Cos[2 Pi*t] + 1) + 1/5, 0.2 (Sin[4 Pi*t] - Sin[2 Pi*t]) + 1/2, ((2.5 (t - 1/2)) - (2.5 (t - 1/2))^3 + 45/64) 32/45}; tubes = ParametricPlot3D[{p[t], {1/2, 1/2, t}, {4/5, 1/2, t}}, {t, 0, 1}, PlotStyle -> Directive[Specularity[White,10], Purple, Opacity[.6]] ] /. Line[pts_] :> {CapForm[None], Tube[pts, r]}; join = ParametricPlot3D[{ {1/5, 1/2, 0} + r {Cos[t], Sin[t], 0}, {1/2, 1/2, 0} + r {Cos[t], Sin[t], 0}, {4/5, 1/2, 0} + r {Cos[t], Sin[t], 0}, {1/5, 1/2, 1} + r {Cos[t], Sin[t], 0}, {1/2, 1/2, 1} + r {Cos[t], Sin[t], 0}, {4/5, 1/2, 1} + r {Cos[t], Sin[t], 0} }, {t, 0, 2 Pi}, PlotStyle -> Directive[Thick, Purple, Opacity[0.2]] ]; Show[{sides, topBot, tubes, join}, ViewPoint -> {1.25833, -2.927, 1.1384}] 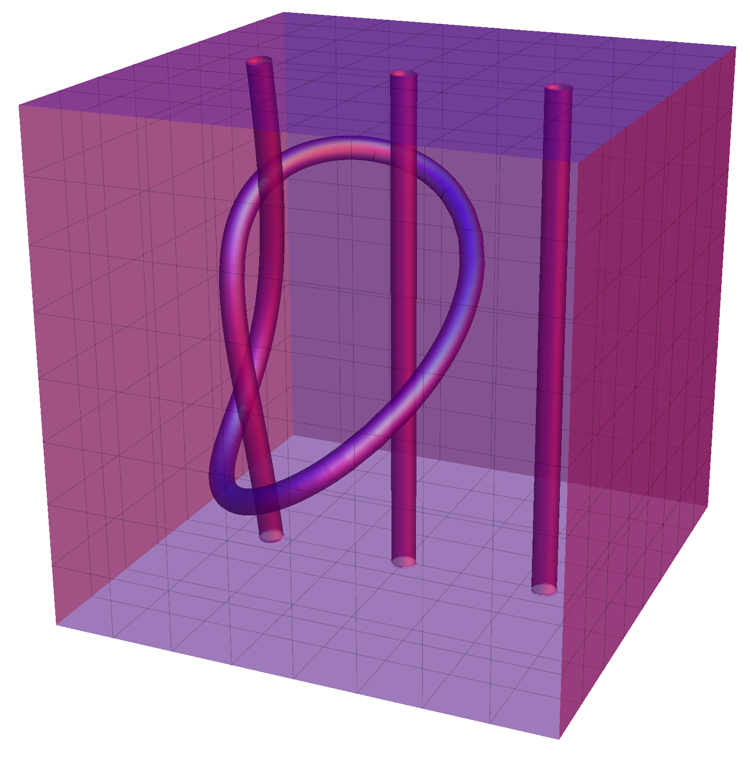
/. Line[pts_] :> { , which is very cool because it is followed after the plot function and Line is not explicitly appear in the plot function. I just want to know more of these cool. $\endgroup$ ParametricPlot3D) produce graphics primitives (like Line). So, if you execute something like InputForm[ParametricPlot3D[{t,t,t}, {t,0,1}], you'll see that a Line has been produced. The /.Line[pts_] :> business simply replaces it with a Tube. $\endgroup$ p[t_] = {0.1 (Cos[4 Pi*t] - 2 Cos[2 Pi*t] + 1) + 1/5, 0.2 (Sin[4 Pi*t] - Sin[2 Pi*t]) + 1/2, ((2.5 (t - 1/2)) - (2.5 (t - 1/2))^3 + 45/64) 32/45};can you tell me a little about how you came up with this function?is there some secret of making this... $\endgroup$ As MichaelE2's comment there are a number of ways of generating the left figure.
Using whubers circle function.:
circle[x_, n_: 32] := {x + Cos[#], Sin[#], 0} & /@ Range[0, 2 \[Pi], 2 \[Pi]/n]; Graphics3D[{LightBlue, Tube[circle[#] & /@ Range[-2, 2, 2], 0.4]}, Boxed -> False] gives:

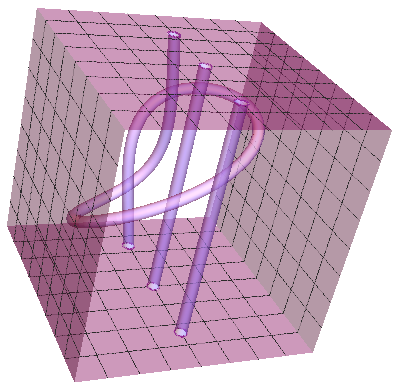
Mark McClure's construction of a boxes six sides, putting tubes inside and holes in parallel sides and joining the tube ends to the side holes gets my vote. Just looking inside the 'purple box' by removing two sides shows the internal plumbing:
I post the following (which "drills" holes in the cubic region), not as efficient but as a way, using Mark McClure's parametric curve. If the extrusion is too big the tube intersects itself and it takes much longer.
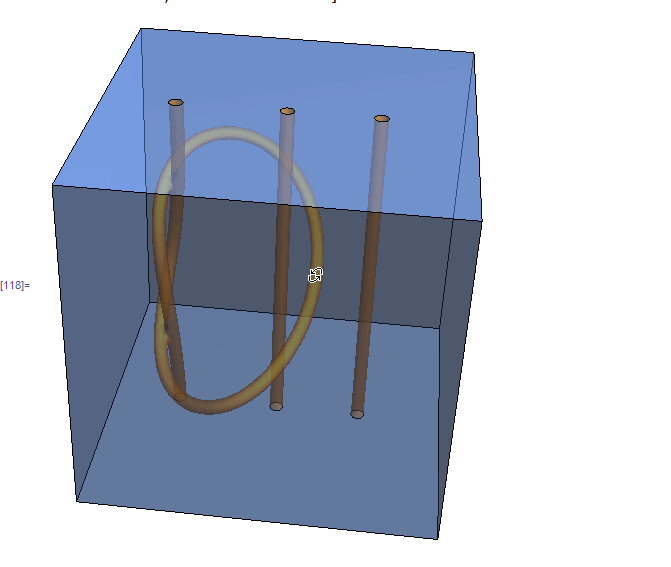
p[t_] = {0.1 (Cos[4 Pi*t] - 2 Cos[2 Pi*t] + 1) + 1/5, 0.2 (Sin[4 Pi*t] - Sin[2 Pi*t]) + 1/2, ((2.5 (t - 1/2)) - (2.5 (t - 1/2))^3 + 45/64) 32/45}; pp = ParametricPlot3D[p[t], {t, 0, 1}]; reg = First@Cases[pp, Line[x__], Infinity]; rf = RegionDistance[reg] h2 = Line[Table[{1/2, 1/2, j}, {j, 0, 1, 0.1}]]; rf2 = RegionDistance[h2]; h3 = Line[Table[{3/4, 1/2, j}, {j, 0, 1, 0.1}]]; rf3 = RegionDistance[h3]; RegionPlot3D[ rf[{x, y, z}] > 0.02 && rf2[{x, y, z}] > 0.02 && rf3[{x, y, z}] > 0.02, {x, 0, 1}, {y, 0, 1}, {z, 0, 1}, PlotStyle -> Opacity[0.5], Axes -> False, Boxed -> False, Mesh -> False, PlotPoints -> 100] gives this:
This takes sometime on my machine...
ParametricPlot3D$\endgroup$