How can I plot x from 0 to 1, and x^2, from 1 to 2?
Plot[{x, x^2}, {x, 0, 2}] Thus, in a way, I want to combine the two functions into one plot.
How can I plot x from 0 to 1, and x^2, from 1 to 2?
Plot[{x, x^2}, {x, 0, 2}] Thus, in a way, I want to combine the two functions into one plot.
Combine Plots with Show, and remember to use PlotRange -> All:
Show[ Plot[x, {x, 0, 1}, PlotStyle -> Blue], Plot[x^2, {x, 1, 2}, PlotStyle -> Red], PlotRange -> All] 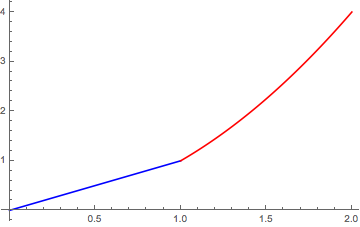
Another option, as Karsten7. stated, is to use piecewise functions with non-numeric default value outside their domain:
Plot[ {Piecewise[{{x, x < 1}}, Null], Piecewise[{{x^2, x >= 1}}, Null]}, {x, 0, 2}] 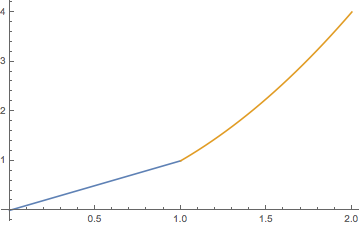
Then again, if you are really interested of not having separate plots, you probably want a direct Piecewise expression like:
Plot[ Piecewise[ {{x, x < 1}, {x^2, x >= 1}}], {x, 0, 2}] 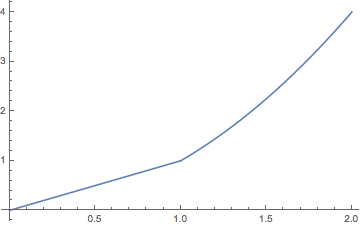
Show[Plot[x^2, {x, 1, 3}], Plot[x, {x, 0, 1}], PlotRange -> All]$\endgroup$Piecewiseor similar functions. $\endgroup$