What I want to do:
Put horizontal lines on top of every bar of a grouped bar plot with symbolic x axis coordinates. The lines shall align with the width of each bar. See the 2 example bars with lines in the code and the image below.
Note, that these lines are used to indicate an "upper bound" for each bar. Hence, every line has its own y-coordinate which is independent from the actual height of the bar.
What I have so far:
I only came up with an unsatisfying solution:
Draw simple lines by a \draw call and approximating the x-coordinates by hand.
Why is this a problem?
This leads to the very ugly "magic" numbers (e.g. !.655!, !.862!) for the x-coordinate calculation as you can see in the code below. This becomes very tedious since I have many bars and the number of bars per group may change.
What is missing to solve my problem?
I am looking for a more convenient way to calculate (or get) the min/max x-coordinates of the individual bars. With these coordinates which are indicated with black ticks in the image below, I can easily draw the desired lines.
My current approach is based on the following MWE:
\documentclass[11pt]{standalone} \usepackage{tikz} \usetikzlibrary{calc} \usepackage{pgfplots} \begin{document} \begin{tikzpicture} \begin{axis}[ ybar, enlargelimits=0.15, ylabel={index}, symbolic x coords={1982, 1990, 1999, 2006}, legend style={at={(0.5,-0.15)}, anchor=north,legend columns=-1}, ] \addplot coordinates {(1982, 1.78) (1990, 1.71) (1999, 1.68) (2006, 1.62)}; \addplot coordinates {(1982, 1.70) (1990, 1.62) (1999, 1.59) (2006, 1.64)}; \addplot coordinates {(1982, 2.04) (1990, 1.96) (1999, 1.95) (2006, 1.91)}; \draw[blue, thick] ($(axis cs:1982, 1.72)!.655!(axis cs:1990, 1.72)$) -- ($(axis cs:1982, 1.72)!.862!(axis cs:1990, 1.72)$); \draw[red , thick] ($(axis cs:1982, 1.68)!.89!(axis cs:1990, 1.68)$) -- ($(axis cs:1990, 1.68)!.115!(axis cs:1999, 1.68)$); \legend{USA, Netherlands, {(West-)Germany}} \end{axis} \end{tikzpicture} \end{document} 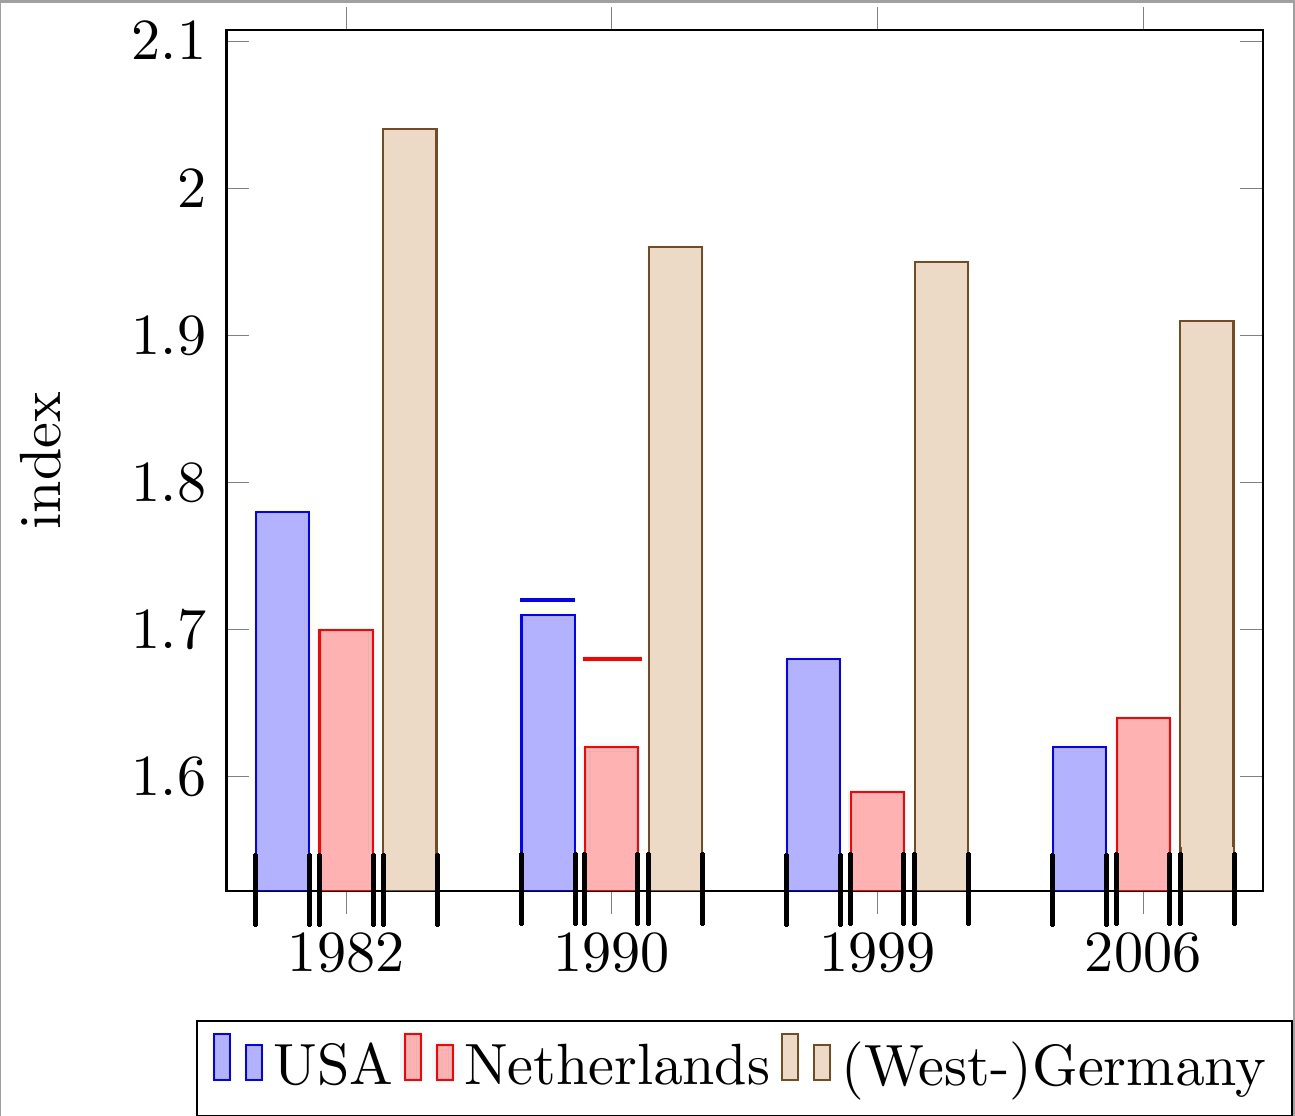
Any help is very appreciated.
edit: clarified question.


$\overline$on top of bars?. for conviniece, please provide code what you try so far (by which the plot in your question has been generated).