return early
For the special case, n_max == -1, you can return early
def hexit_60(n_max): if n_max == -1: return None
This allows you to simplify the loop a lot
special case
the part before the for-loop can be included in the main loop by taking one of the other answers to your int question, and use casting.
reverse
The reverse of seq is also the negative. If you extract the (n-1)*[-n] to another variable, you can make this a lot clearer.
np.roll
np.hstack((p0[N-2*n:], p0[:N-2*n])) is equivalent to np.roll(p0, 2 * n)
generator
You can make the hexit_60 into a generator, even further simplifying it
def hexit_60_gen(n_max): if n_max == -1: return yield np.zeros(2, dtype=int)[:, None] for n in range(1, n_max + 1): seq = np.arange(-n, n + 1, dtype=int) middle = np.array((n - 1) * [-n], dtype=int) p0 = np.hstack((-seq, middle, seq, -middle,)) p1 = np.roll(p0, 2 * n) yield np.vstack((p0, p1))
This code is a lot clearer to read to me.
It generates the same points:
all( np.array_equal( hexit_60(n_max), np.hstack(list(hexit_60_gen(n_max))) ) for n_max in range(10) )
get_points
You need to adapt this slightly:
def get_points_gen(a, n_max): vecs = a * np.array([[1.0, 0.0], [0.5, 0.5 * np.sqrt(3)]]) pairs = list(hexit_60_gen(n_max=n_max)) if pairs: return (np.hstack(pairs)[:, None] * vecs[..., None]).sum(axis=0)
if pairs is empty, this returns None implicitly.
The one thing I would is replace [0.5, 0.5 * np.sqrt(3)] by
angle = np.pi / 3 # diagonal [np.cos(angle), np.sin(angle)]
So you don't have as many magic numbers in the code
draw_hexagon
can be simplified with a slight reordering and a continue
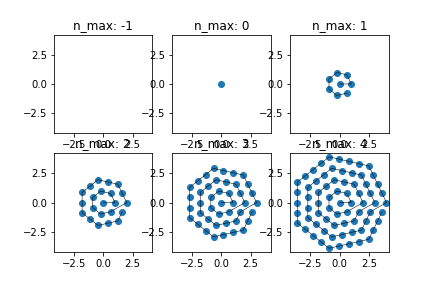
def draw_hexagon(): fig = plt.figure() for i, n_max in enumerate([-1, 0, 1, 2, 3, 4]): ax = fig.add_subplot(2, 3, i+1) # plt.subplot(2, 3, i+1) ax.set_title('n_max: ' + str(n_max)) points = get_points_gen(a=1.0, n_max=n_max) ax.set_xlim(-4.2, 4.2) ax.set_ylim(-4.2, 4.2) if points is None: continue x, y = points ax.scatter(x, y) ax.plot(x, y, '-k', linewidth=0.5) ax.set_aspect('equal') plt.show()
This latest part can be made a bit cleaner, using the principles of clean architecture, but this is good enough, or a bit more parametrized, but this is good enough.
--
alternative approach
Instead of the approach of the hexit_60, you can have a function to assemble the first side of the hexagon, and then apply rotations to this:
ANGLE = np.pi / 3 COS_ANGLE = np.cos(ANGLE) SIN_ANGLE = np.sin(ANGLE) ROTATION_MATRIX = [[COS_ANGLE, -SIN_ANGLE], [SIN_ANGLE, COS_ANGLE]]
Then to get one side, using np.linspace to do the interpolation:
def side_points(n): if n == 0: return np.array([[0], [0]]) p0 = np.array([n, 0]) p1 = n * np.array([COS_ANGLE, SIN_ANGLE]) return np.linspace(p0, p1, n, endpoint=False).T
And then the rotations is a simple generator
def rotations(side): yield side if np.array_equal(side, np.array([[0], [0]])): return for _ in range(5): side = np.dot(ROTATION_MATRIX, side) yield side
Note that this can be easily adjusted to any regular polygon, by adjusting the angle, and passing in the appropriate cosinus, sinus and or rotation_matrix as function parameter instead of using the global
from functools import lru_cache @lru_cache(None) def cos_angle(sides): return np.cos(2 * np.pi / sides) @lru_cache(None) def sin_angle(sides): return np.sin(2 * np.pi / sides) @lru_cache(None) def rotation_matrix(sides): return np.array( [ [cos_angle(sides), -sin_angle(sides)], [sin_angle(sides), cos_angle(sides)], ] ) def side_points(n, sides=6): if n == 0: return np.array([[0], [0]]) p0 = np.array([n, 0]) p1 = n * np.array([cos_angle(sides), sin_angle(sides)]) return np.linspace(p0, p1, n, endpoint=False).T def rotations(side, sides=6): yield side if np.array_equal(side, np.array([[0], [0]])): return rot = rotation_matrix(sides) for _ in range(sides - 1): side = np.dot(rot, side) yield side def points(n_max, sides=6): return np.hstack( list( itertools.chain.from_iterable( rotations(side_points(n, sides), sides) for n in range(n_max + 1) ) ) )
Then drawing the polygon is simply:
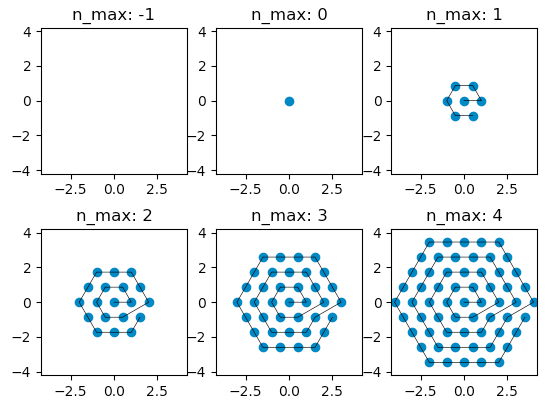
def draw_polygon(sides=6): fig = plt.figure() for i, n_max in enumerate([-1, 0, 1, 2, 3, 4]): ax = fig.add_subplot(2, 3, i + 1) # plt.subplot(2, 3, i+1) ax.set_title("n_max: " + str(n_max)) ax.set_xlim(-4.2, 4.2) ax.set_ylim(-4.2, 4.2) if n_max < 0: continue all_points = points(n_max, sides=sides) ax.scatter(*all_points) ax.plot(*all_points, "-k", linewidth=0.5) ax.set_aspect("equal") return fig
draw_polygon(7)