I'm writing a tutorial on traditional time series forecasting models. One key issue with ARIMA models is that they cannot model seasonal data. So, I wanted to get some seasonal data and show that the model cannot handle it.
However, it seems to model the seasonality quite easily - it peaks every 4 quarters as per the original data. What is going on?
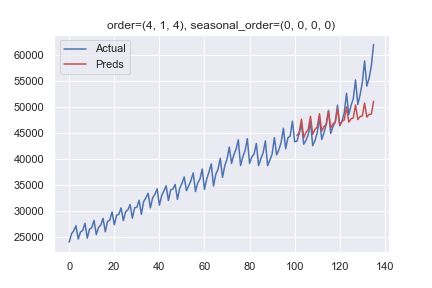
Code to reproduce the plot
from statsmodels.datasets import get_rdataset from statsmodels.tsa.arima.model import ARIMA import matplotlib.pyplot as plt import seaborn as sns sns.set() # Get data uk = get_rdataset('UKNonDurables', 'AER') uk = uk.data uk_pre1980 = uk[uk.time <= 1980] # Make ARIMA model order = (4, 1, 4) # Without a seasonal component seasonal_order = (0, 0, 0, 0) arima = ARIMA(uk_pre1980.value, order=order, seasonal_order=seasonal_order, trend='n') res = arima.fit() # Plot all_elements = len(uk) - len(uk_pre1980) plt.plot(uk.value, 'b', label='Actual') plt.plot(res.forecast(steps=all_elements), 'r', label='Preds') plt.title(f'order={order}, seasonal_order={seasonal_order}') plt.legend() plt.show()