2
$\begingroup$

I have a retail dataset. I am trying to identify groups of products which are generally bought within a span of few days or on the same days (consider multiple store visits). For example - If someone is doing a painting DIY project at their house, they'd buy paints, paint rollers, painters tape, putty, putty knife etc, before and during the project.

My dataset looks like below:

enter image description here

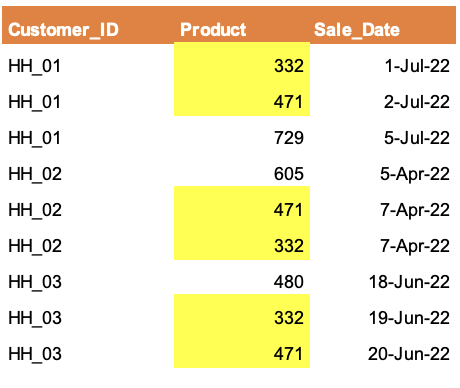
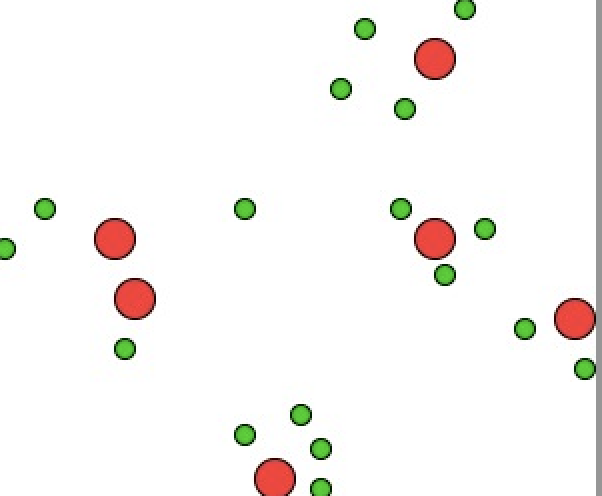
Above, you could see that products #332 & #471 were bought within few days by all the 3 customers. So these products are kind of associated. This suggests that customers who are doing a project X, they tend to buy #332 & #471 together. At the end of the day, I want to divide the product universe in few product clusters, where each cluster could be identified as some kind of project, something like below.

enter image description here

The way I am thinking to perform this is by:

  1. Performing Apriori. Get lifts for {A => B}
  2. Use lifts to create a m x m matrix, each data value will be a lift, m = number of products (in my case ~200)
  3. Standardize, and perform PCA to reduce dimension (to 5 or 6)
  4. Perform k-means on m x n dataframe. This would give me products who have similar lifts towards the same products.

I am not sure if there are other techniques. Please let me know if anyone has experience working on similar use cases or have any suggestions. (PS: I have done clustering of customers using RFM, but RFM can't be applied here since it'll be a grouping of products and not customers)

$\endgroup$

1 Answer 1

1
$\begingroup$

Why not use dimensional reduction algorithms?

UMAP or t-SNE are quite simple to implement, they are non-linear (contrary to PCA) and they make meaningful clusters. Then, you can apply a KMeans.

Here is an example with UMAP:

import pandas as pd import numpy as np import umap import sklearn.cluster as cluster mydata = ... #Dataframe with numeric features mapper = umap.UMAP().fit(mydata) umap.plot.points(mapper) #After checking how many labels you have: kmeans_labels = cluster.KMeans(n_clusters=10).fit_predict(mydata) #you can also display a PCA diagnostic umap.plot.diagnostic(mapper, diagnostic_type='pca') 

Sources:

https://umap-learn.readthedocs.io/en/latest/plotting.html

https://plotly.com/python/t-sne-and-umap-projections/

https://umap-learn.readthedocs.io/en/latest/clustering.html

$\endgroup$
3
  • $\begingroup$ Does it answer your question? If not, please let me know. $\endgroup$ Commented Aug 23, 2022 at 14:09
  • $\begingroup$ Thanks Martin, I could not get the time yet to test this and check the results. But I will comeback once I have this done. $\endgroup$ Commented Aug 23, 2022 at 15:56
  • $\begingroup$ Very well, no rush :) $\endgroup$ Commented Aug 23, 2022 at 18:01

Start asking to get answers

Find the answer to your question by asking.

Ask question

Explore related questions

See similar questions with these tags.