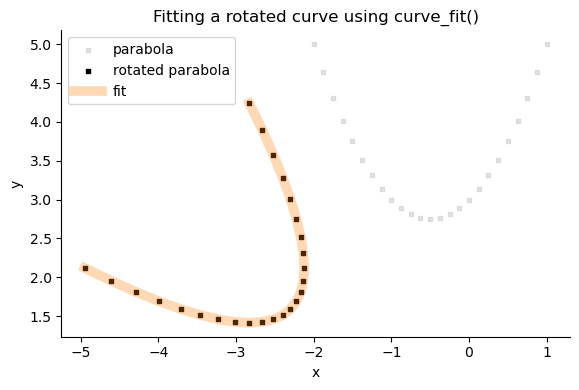
The approach below fits to a rotated parabola.
I estimate the coefficients $A, B, C$ by first removing the rotation (rotate $-\theta$). Then I plug in the coefficients of a regular parabola, and finally rotate the result back.
I give curve_fit() both the $x$ and $y$ coordinates (your code only supplies $x$ to the model).
The model function rotated_parabola() does the following:
- Assume $x, y$ are in rotated space. Undo the rotation on $x$ by applying $-\theta$ to $x$.
- Now it's a regular parabola, where we estimate $A, B, C$.
- Rotate the estimated $y$ back to the original orientation by applying $\theta$.
Reproducible example
import numpy as np from scipy.optimize import curve_fit from matplotlib import pyplot as plt np.set_printoptions(suppress=True) # # Synthesise test data # It's a parabola defined by A, B, C, which is then rotated by THETA # THETA = 45 * np.pi/180 A, B, C = (1, 1, 3) #Generate the parabola defined by A, B, C data_x_parab = np.linspace(-2, 1, num=25) data_y_parab = A * data_x_parab**2 + B * data_x_parab + C #Rotate the parabola by THETA data_xy = (data_x, data_y) = ( np.row_stack([ (np.cos(THETA), -np.sin(THETA)), (np.sin(THETA), np.cos(THETA)) ]) @ np.row_stack([data_x_parab, data_y_parab]) ) def rotated_parabola(xy, theta, a, b, c): x, y = xy #First, apply -theta to reverse the rotation x_parabola = x * np.cos(-theta) - y * np.sin(-theta) # Parabola equation is now valid # Fit the parameters (a, b, c) of the parabola y_parabola = a * x_parabola**2 + b * x_parabola + c # Rotate the fitted point back into the original space y_fit = x_parabola * np.sin(theta) + y_parabola * np.cos(theta) return y_fit #Fit popt, pcov = curve_fit(rotated_parabola, data_xy, data_y) print( 'Data parameters:', THETA * 180/np.pi, A, B, C, '\n' 'Fitted parameters:', round(popt[0] * 180/np.pi), *popt[1:].round(1) ) # # Plot data # f, ax = plt.subplots(figsize=(8, 4), layout='tight') #Data ax.scatter(data_x_parab, data_y_parab, marker='s', s=12, alpha=0.1, color='black', label='parabola') ax.scatter(data_x, data_y, marker='s', s=12, color='black', label='rotated parabola') #Plot the fitted curve y_fitted = rotated_parabola(data_xy, *popt) ax.plot(data_x, y_fitted, color='tab:orange', linestyle='-', linewidth=7, alpha=0.3, label='fit') #Formatting ax.legend() ax.spines[['top', 'right']].set_visible(False) ax.set(xlabel='x', ylabel='y', title='Fitting a rotated curve using curve_fit()'); ax.set_aspect('equal')