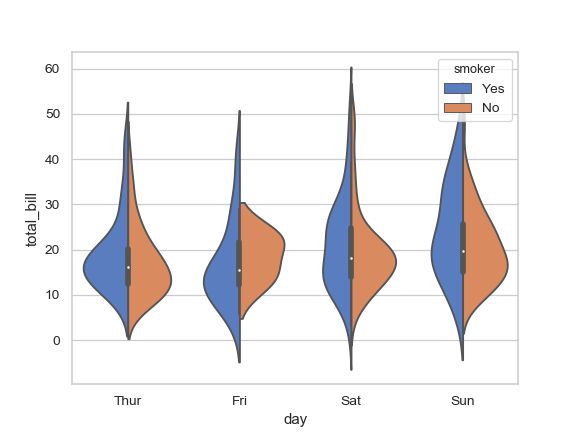
I'm trying to plot a violin plot with a split based on Sex ( like in the fourth example in the doccumentation but with Sex)
I can produce a categorical scatter plot and split it by Sex. However, when i attempt the same but as a violin plot; it throws an error.
Traceback (most recent call last): File "<ipython-input-868-0599b976fd6c>", line 1, in <module> sns.catplot(x="Batch", y="Age", hue = 'Sex', data = ages, kind='violin') File "/home/tasty/anaconda3/lib/python3.7/site-packages/seaborn/categorical.py", line 3755, in catplot g.map_dataframe(plot_func, x, y, hue, **plot_kws) File "/home/tasty/anaconda3/lib/python3.7/site-packages/seaborn/axisgrid.py", line 820, in map_dataframe self._facet_plot(func, ax, args, kwargs) File "/home/tasty/anaconda3/lib/python3.7/site-packages/seaborn/axisgrid.py", line 838, in _facet_plot func(*plot_args, **plot_kwargs) File "/home/tasty/anaconda3/lib/python3.7/site-packages/seaborn/categorical.py", line 2387, in violinplot color, palette, saturation) File "/home/tasty/anaconda3/lib/python3.7/site-packages/seaborn/categorical.py", line 564, in __init__ self.estimate_densities(bw, cut, scale, scale_hue, gridsize) File "/home/tasty/anaconda3/lib/python3.7/site-packages/seaborn/categorical.py", line 679, in estimate_densities kde, bw_used = self.fit_kde(kde_data, bw) File "/home/tasty/anaconda3/lib/python3.7/site-packages/seaborn/categorical.py", line 719, in fit_kde kde = stats.gaussian_kde(x) File "/home/tasty/anaconda3/lib/python3.7/site-packages/scipy/stats/kde.py", line 208, in __init__ self.set_bandwidth(bw_method=bw_method) File "/home/tasty/anaconda3/lib/python3.7/site-packages/scipy/stats/kde.py", line 540, in set_bandwidth self._compute_covariance() File "/home/tasty/anaconda3/lib/python3.7/site-packages/scipy/stats/kde.py", line 551, in _compute_covariance aweights=self.weights)) File "/home/tasty/anaconda3/lib/python3.7/site-packages/numpy/lib/function_base.py", line 2427, in cov avg, w_sum = average(X, axis=1, weights=w, returned=True) File "/home/tasty/anaconda3/lib/python3.7/site-packages/numpy/lib/function_base.py", line 419, in average scl = wgt.sum(axis=axis, dtype=result_dtype) File "/home/tasty/anaconda3/lib/python3.7/site-packages/numpy/core/_methods.py", line 36, in _sum return umr_sum(a, axis, dtype, out, keepdims, initial) TypeError: No loop matching the specified signature and casting was found for ufunc add My code is:
>>> print(ages.head()) Age Sex Batch PassengerId 852 74 male Train 86 33 female Train 161 44 male Train 812 39 male Train 837 21 male Train >>> sns.catplot(x="Batch", y="Age", hue = 'Sex', data = ages, kind='violin') Removing the kind argument produces the following scatterplot: 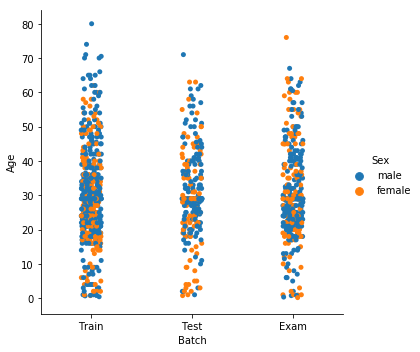
How do I get rid of the error to display the data as a violin plot?
Thanks in advance
edit: Seaborn version: 0.9.0 Numpy version: 1.16.2 Python version: 3.7.3