I am using clustering for my data. Since the DBSCAN algorithm will also tell me an estimate of clusters that I can use, I have used DBSCAN. I have tried for the eps=[0.123,1,2] and min_smaples=[2,10,...60]. The print satatement in the below code prints 714 which is equal to the number of data-samples(rows). The code looks like:
dbscan = DBSCAN(eps=1, min_samples = 4) clusters = dbscan.fit_predict(df) print(len(clusters)) plt.scatter(df.iloc[:, 0], df.iloc[:, 1], c=clusters, cmap="plasma") plt.xlabel("Feature 0") plt.ylabel("Feature 1") Sample plots for some of the different min_samples is shown below:
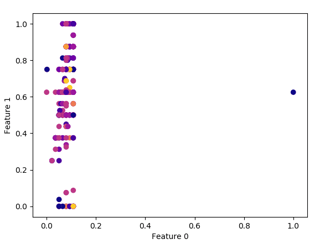
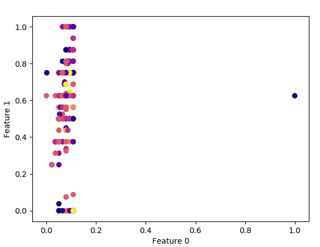
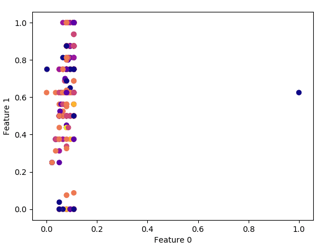
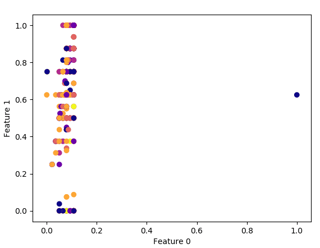
The parameters for the above plots are given below in the same pattern.
- EPS=1, MIN_SAMPLES=2, EPS=1, MIN_SAMPLES=10
- EPS=1, MIN_SAMPLES=20, EPS=1, MIN_SAMPLES=40
None of these plots are making sense to me from a clustering perspective. From this, I am forced to conclude that I cannot use clustering for the given data or I am doing it wrong. So, I need help with insights into the weird appearance of the above plots.
Any help is appreciated