-
-

-

-
-
-
-

-

-
-
-

-

-
-
-

-
-

-
-

-
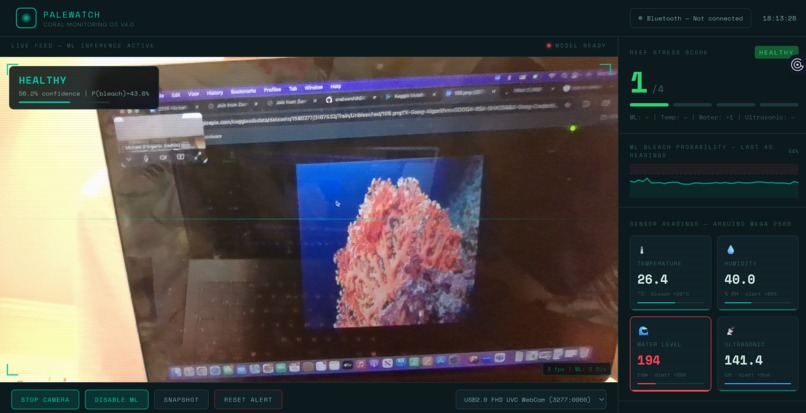
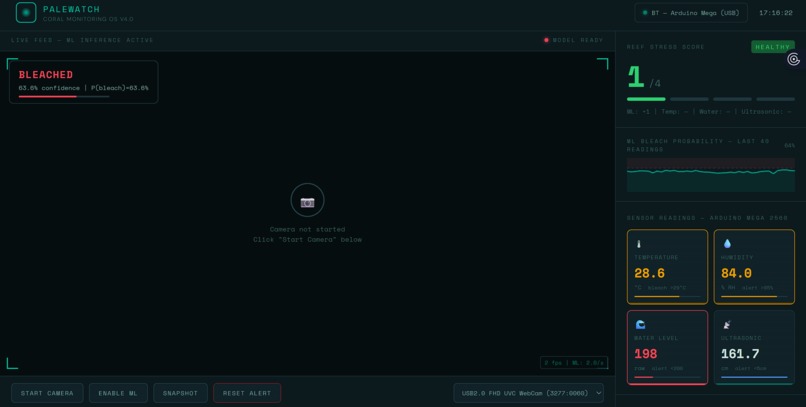
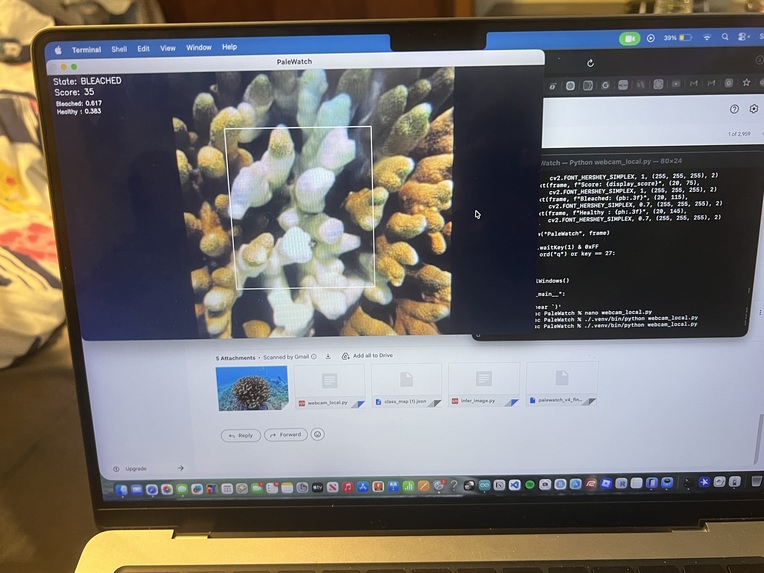
Confidence is low due to noise
PALEWATCH OS — PROJECT STORY
WHAT INSPIRED US
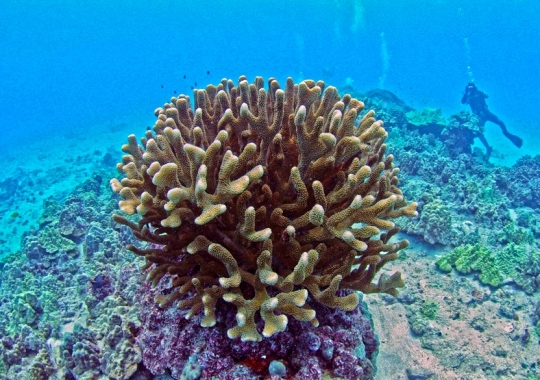
The idea for PaleWatch OS came from a frustrating reality in coral conservation: most bleaching events are only documented after the damage is done.
We kept reading about coral nursery programs where researchers would check on their tanks in the morning and find bleached coral that had stressed overnight. The culprit was almost always something invisible and preventable: an HVAC system that cycled off at night pushing room temperature up, a small runoff event after rain that nobody caught, or a gradual temperature creep that crossed the bleaching threshold while everyone was asleep.
The tools that existed were either expensive commercial monitoring systems that small labs and classrooms could not afford, or they were single-sensor setups that only told you one piece of the story. A temperature alert alone does not tell you if the coral is actually bleaching. A camera alone does not tell you if a runoff pulse just hit the water.
We wanted to build something that looked at the whole picture at once, cost under fifty dollars in hardware, and could run in any classroom, nursery, or research lab in the world. That became PaleWatch OS.
HOW WE BUILT IT
We built PaleWatch OS in three distinct layers that each had to work before we could connect them together.
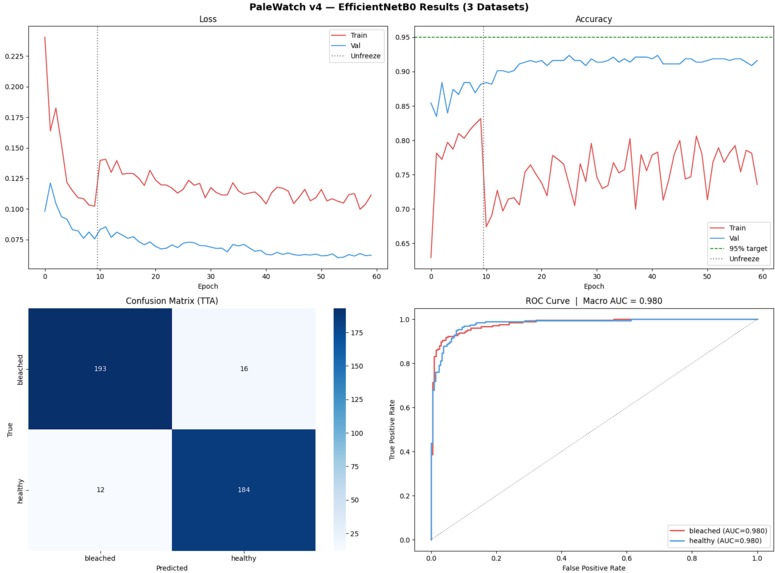
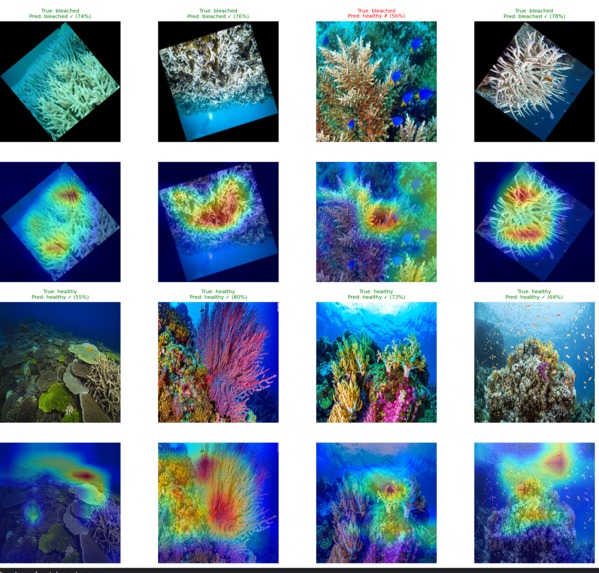
The first layer was the machine learning model. We started in Kaggle, sourcing coral images from three separate datasets and merging them into a single unified training set of 3,962 images. We trained an EfficientNetB0 convolutional neural network using a two-phase approach: first training only the classifier head while the backbone stayed frozen, then unfreezing the entire network for fine-tuning with MixUp and CutMix augmentation. After 60 epochs and test-time averaging the model hit 95.63 percent test accuracy.
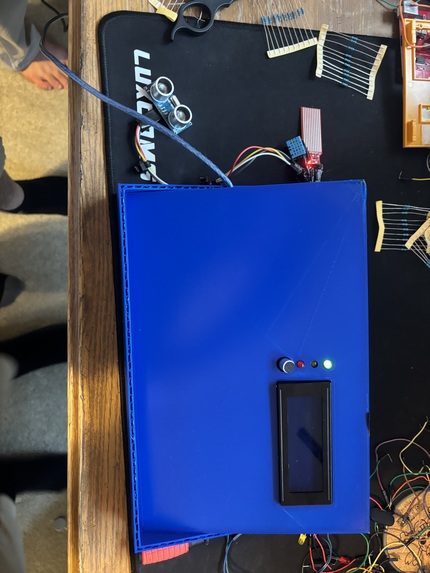
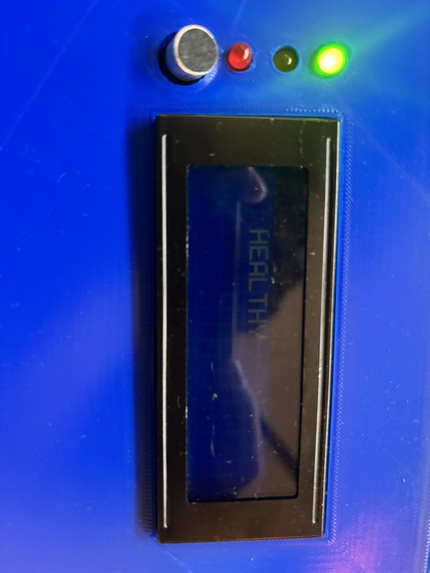
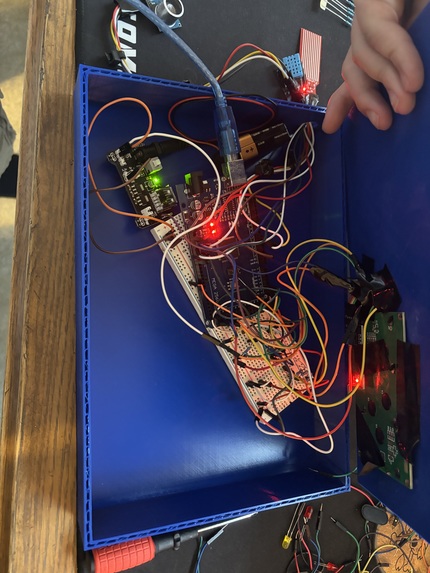
The second layer was the hardware. We wired a DHT11 temperature and humidity sensor, a moisture sensor for runoff detection, and an HC-SR04 ultrasonic sensor to an Arduino Mega 2560. We added three LEDs for visual status, a buzzer for critical alerts, a servo motor to control a vent flap, and an I2C LCD display. The Arduino firmware runs completely standalone, calculating its own stress score and driving all physical outputs without needing the laptop to be connected.
The third layer was getting the ML model into the browser. This was the most technically involved part of the project. We exported the trained PyTorch model to ONNX format, converted it to a TensorFlow SavedModel, and then converted that to TensorFlow.js so it could run directly in Chrome. We built a Python WebSocket bridge that reads the Arduino serial data over USB and forwards it to the web dashboard in real time. The dashboard fuses the live camera ML predictions with the sensor readings into a single stress score from 0 to 4.
WHAT WE LEARNED
We learned that getting a model to train well in Kaggle and getting that same model to run accurately in a browser are two completely different problems.
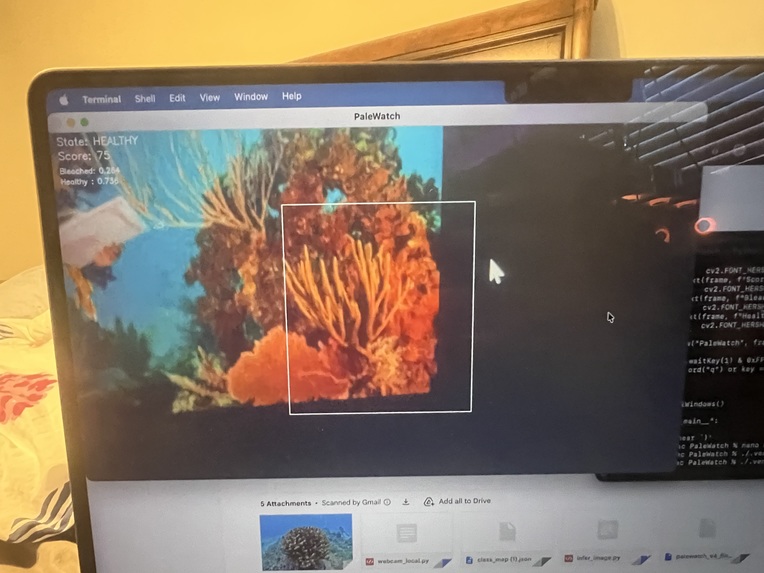
The conversion pipeline from PyTorch to ONNX to TensorFlow to TensorFlow.js introduces subtle numerical differences at each step. Our first browser deployment was running the model with the wrong normalization, which kept confidence scores stuck around 60 percent even though the Kaggle test accuracy was 95 percent. Fixing the normalization to use proper ImageNet mean and standard deviation values, and switching from the legacy softmax call to the correct TensorFlow.js API, brought the confidence up to where it should be.
We also learned a lot about embedded systems design. The decision to make the Arduino fully autonomous rather than dependent on the laptop came from thinking through failure modes. If the Python bridge crashes, if Chrome freezes, if the laptop runs out of battery, the coral is still being monitored and the buzzer will still go off. Building the hardware layer to be self-sufficient made the whole system far more reliable in practice.
On the data side we learned how much dataset quality matters. Our first model trained on a single dataset of 923 images plateaued at around 82 percent. Adding two more datasets to reach 3,962 images pushed accuracy to 95.63 percent. More data, especially diverse data from different sources and conditions, was more impactful than any architectural change we made.
CHALLENGES WE FACED
The biggest challenge was the model conversion pipeline. Every step introduced a new potential failure point. The onnx-tf library failed due to a protobuf version conflict in the Kaggle environment. We had to fall back to onnx2tf as an alternative converter. The TensorFlow.js command line converter then failed because tensorflow_decision_forests had a broken import chain. We ended up calling the TensorFlow.js Python API directly rather than using the command line tool, which finally worked.
The second major challenge was the browser normalization bug. Because the model was producing plausible-looking outputs (correctly identifying bleached versus healthy most of the time) it was not obvious that the normalization was wrong. Only when we printed the raw logits to the console and saw values of 0.70 and 0.07 instead of the expected 3.5 and negative 2.1 did we realize the predictions were far less sharp than they should be.
On the hardware side, the LCD display caused the Arduino to hang completely on boot because the while Serial loop was blocking execution before the I2C bus had time to initialize. Removing the blocking wait and adding a 2 second delay at the start of setup fixed it.
Finding the correct I2C address for the LCD also required writing a separate scanner sketch and running it before the main firmware would work.
The COM port conflict between Arduino IDE Serial Monitor and bridge.py caught us off guard multiple times during development. Only one program can hold a serial port at a time, and switching between debugging in Arduino IDE and running the full system required remembering to close Serial Monitor every single time.
Despite all of this, every problem had a solution, and working through each one gave us a much deeper understanding of the full stack from sensor to model to browser than we would have gotten from a simpler project.
THE PROJECT IN ONE SENTENCE
PaleWatch OS is a fifty dollar early warning system for coral nurseries that combines a 95 percent accurate bleaching detection model running live in a browser with a fully autonomous Arduino sensor array, built because the tools that existed were either too expensive or too limited to catch the problem before it was too late.

Log in or sign up for Devpost to join the conversation.