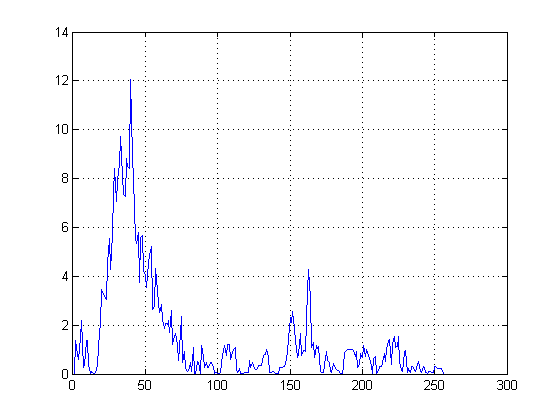
I am running Morlet continuous wavelet transform. I have got wscalogram of signal and now I want to plot freq-magnitude like the following picture., but I don't know how to do it:

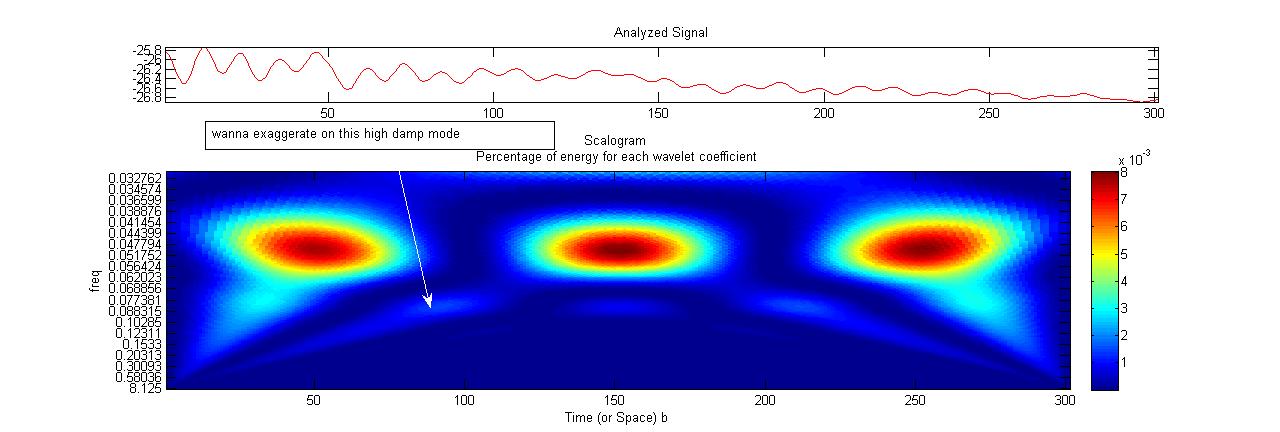
I've used scal2freq MATLAB function to convert scales to pseudo frequencies. Also I have some frequencies in my signal that have a large damping ratio(4%) so they are not well visible in plot. How can I exaggerate these highly damped modes?
I am using MATLAB, here is my codes:
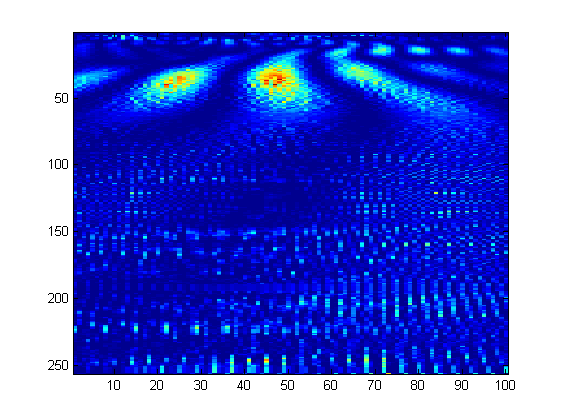
% Import the text4.txt to matlab workspace. and save it under name "data" t=linspace(0,30,301); Fs=ceil(inv(t(2)-t(1))); x=data(:,4); % use x=data(:,3),x=data(:,5) too. first column is time,second is refrence wname = 'morl'; scales = 1:1:256; coefs = cwt(x,scales,wname,'lvlabs'); freq = scal2frq(scales,wname,1/Fs); surf(t,freq,abs(coefs));shading('interp'); axis tight; xlabel('Seconds'); ylabel('Pseudo-Frequency (Hz)'); axis([0 30 0 1 0 60]) xlabel('Time'); ylabel('Frequency'); figure; sc=wscalogram('image',coefs,'scales',freq,'ydata',x); hold on My current plot looks like this: