I'm new to the numerical processing of sampled measurements so my question is probably trivial. Let's suppose that I have the following sampled signal generated in MATLAB:
>> fb = 3229; >> t = 0:(1 / (fb * 100)):150e-3; >> y = exp(1i * 2 * pi * fb * t); (I know that the sampling frequency is much greater than the Nyquist one but it is only to get a finer representation of the function)
The Fourier Transform of my complex signal should be a single Dirac's Delta in fb = 3229 Hz. Now I get the DFT as follows:
>> fy = fftshift(fft(y)); As expected, I get a single spectral line at approximately fb
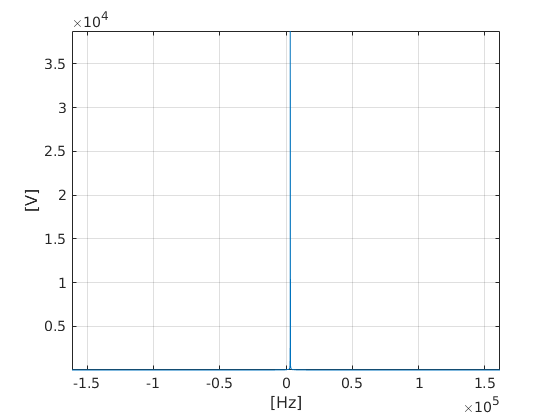
>> N = numel(fy); >> f_ax = (fb * 100) / N * ((- N / 2):(N / 2 - 1)); >> [~,idx] = max(abs(fy)) idx = 24703 >> f_ax(idx) ans = 3.2266e+03 However, the following returned phase is totally unexpected to me
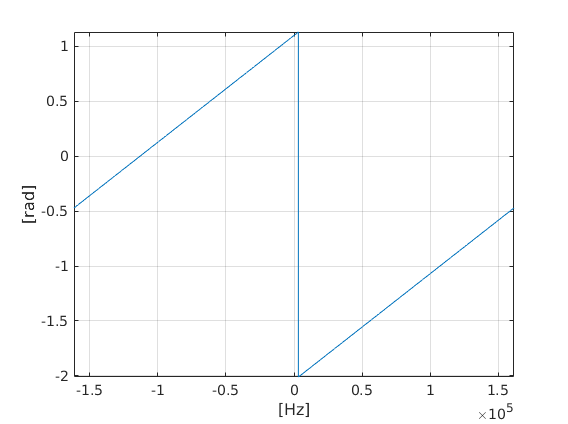
I expected only a single spectral line in the modulus of the DFT and a phase equal to zero on the whole frequency axis. In particular, I get for the bin of fb the following phase
>> angle(fy(idx)) ans = 1.1310 Can someone explain me this behaviour? Thanks