I implemented a Python CA CFAR test for a linear chirp but I arbitrarily chose the number of guard and reference cells. I'm now wondering how to properly choose the CA CFAR parameters (number of guard and reference cells, dB threshold) and how to check whether the resulting $P_d$ and $P_{fa}$ make sense. Here is my code and figures:
import numpy as np import matplotlib.pyplot as plt fs = 25e3 # signal=range cell sampling frequency f = 8e3 # chirp bandwidth T = 129/fs # TX time = chirp duration t = np.arange(0,T,1/fs) chirp = np.exp(2j*np.pi*(f/(2*T))*t**2) MF = 20*np.log10(np.convolve(chirp, np.flip(np.conjugate(chirp)), "same") / np.sum(np.abs(chirp)**2)) # create RP nbr_fs_range_bins = 1000 idx_target1 = 499 RP = np.zeros((nbr_fs_range_bins)) RP[idx_target1:idx_target1+chirp.shape[0]] = chirp complex_noise = np.random.normal(loc=0.0, scale=0.1, size=RP.shape) + 1j*np.random.normal(loc=0.0, scale=0.1, size=RP.shape) # noise added to each range cell corresponding to sampling frequency, AND NOT to range resoluton 1/bandwidth RP = RP + complex_noise RX = np.convolve(RP, np.flip(np.conjugate(chirp)), "same") RX_dB = 20*np.log10(RX / np.sum(np.abs(chirp)**2)) def RP_ca_cfar(RX_dB, n_guard_cells, n_avg_cells, threshold): ca_cfar_thresholds = np.zeros_like(RX_dB) positives_positions = [] for idx in range(n_guard_cells+n_avg_cells, RX_dB.shape[0]-n_guard_cells-n_avg_cells): left = RX_dB[idx-n_guard_cells-n_avg_cells:idx-n_guard_cells] right = RX_dB[idx+n_guard_cells:idx+n_guard_cells+n_avg_cells] avg = (np.mean(left)+np.mean(right)) / 2 ca_cfar_thresholds[idx] = avg if RX_dB[idx] - avg > threshold: positives_positions.append(idx) return ca_cfar_thresholds, positives_positions n_guard_cells = 5 n_avg_cells = 5 threshold = 13 ca_cfar_thresholds, positives_positions = RP_ca_cfar(RX_dB, n_guard_cells, n_avg_cells, threshold) plt.figure(figsize=(12,20)) plt.subplot(511) plt.plot(t,chirp) plt.title(f"Chirp") plt.legend() plt.subplot(512) plt.plot(MF) plt.axhline(-13, color="orange", label="-13 dB") plt.title(f"Chirp matched filter") plt.legend() plt.subplot(513) plt.plot(RX) plt.title(f"Range profile, target with perfect reproduction of chirp in noise") plt.legend() plt.subplot(514) plt.plot(RX_dB) plt.title(f"Range profile (dB), target with perfect reproduction of chirp in noise") plt.legend() plt.subplot(515) plt.plot(RX_dB, label="range profile (dB)") plt.plot(ca_cfar_thresholds, label="adaptive threshold (dB)") plt.vlines(positives_positions, ymin=-100, ymax=1, color="black", alpha=0.2, label="positive range bins") plt.title(f"target detected at: {positives_positions}") plt.legend() 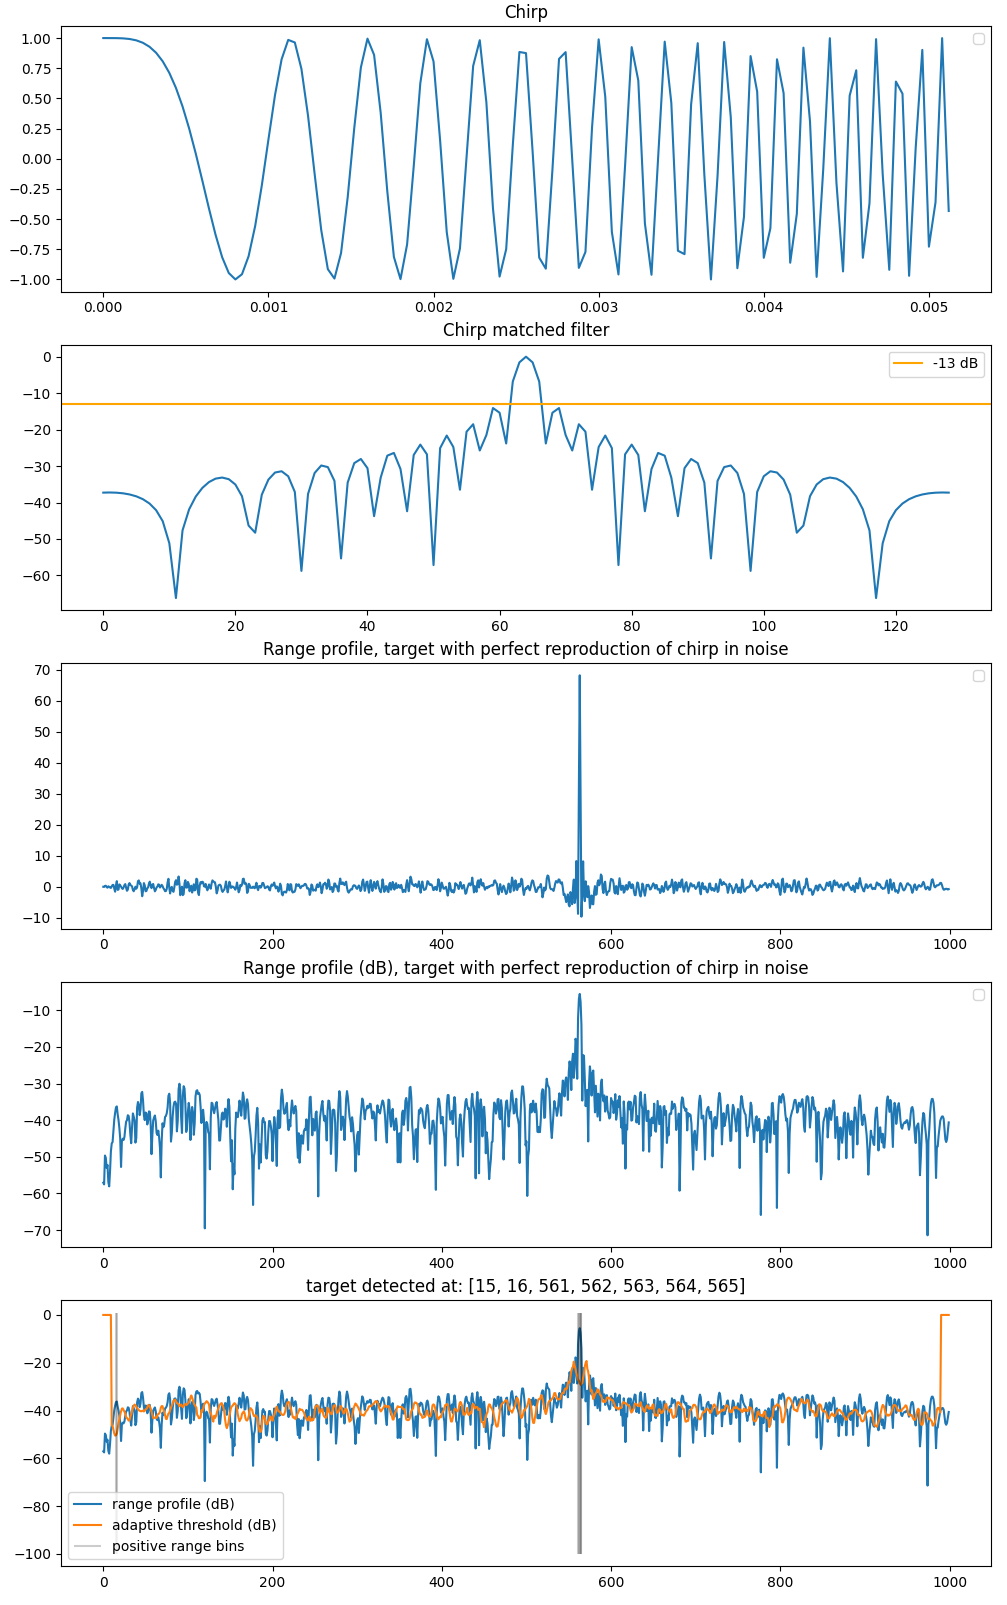
One can see that I currently have a target reflection coefficient of 1 for a signal of amplitude 1, and a gaussian noise of variance of 0.01, leading to a SNR of $20*log_{10}(1/0.01)=40$ dB. I've read a couple of references linking a pre-requisite $P_{fa}$ to the CA CFAR parameters without getting really convinced what to use for my naive range profile simulation.
Among the confusing elements in my implementation:
- range cells correspond to the sampling frequency
fs, which is substantially higher than the chirp bandwidthB(and not a multiple of the latter I might add), which in turn means the range bin1/fsis much smaller than the chirp range resolution1/B. - noise is added range cell-wise, and not "directly" on the sampled signal, but I don't think this changes anything here
This SE site has numerous CA CFAR questions (Q1, Q2, Q3) but the answers don't help much unfortunately.