
![]()
CAFE (Computational Analysis of gene Family Evolution) is a software to analyze changes in gene family size in a way that accounts for phylogenetic history and provides a statistical foundation for evolutionary inferences.
CAFE5 currently does not provide tools to visualize Expansion/Contraction of gene families on phylogenetic tree. To solve this issue, I developed CafePlotter, a tool for plotting CAFE5 gene family expansion/contraction result.
Python 3.8 or later is required for installation.
Install PyPI package:
pip install cafeplotter cafeplotter -i [CAFE5 result directory] -o [Output directory] General Options: -i IN, --indir IN CAFE5 result directory as input -o OUT, --outdir OUT Output directory for plotting CAFE5 result --format Output image format ('png'[default]|'jpg'|'svg'|'pdf') -v, --version Print version information -h, --help Show this help message and exit Figure Appearence Options: --fig_height Figure height per leaf node of tree (Default: 0.5) --fig_width Figure width (Default: 8.0) --leaf_label_size Leaf label size (Default: 12) --count_label_size Gene count label size (Default: 8) --innode_label_size Internal node label size (Default: 0) --p_label_size Branch p-value label size (Default: 0) --ignore_branch_length Ignore branch length for plotting tree (Default: OFF) --expansion_color Plot color of gene family expansion (Default: 'red') --contraction_color Plot color of gene family contraction (Default: 'blue') --dpi Figure DPI (Default: 300) User can download example dataset (singlelambda.zip):
cafeplotter -i ./examples/singlelambda -o ./singlelambda_plot --ignore_branch_length -
summary_all_gene_family.[png|jpg|svg|pdf]
Summary of all expansion/contraction gene family result (from*_clade_result.txt)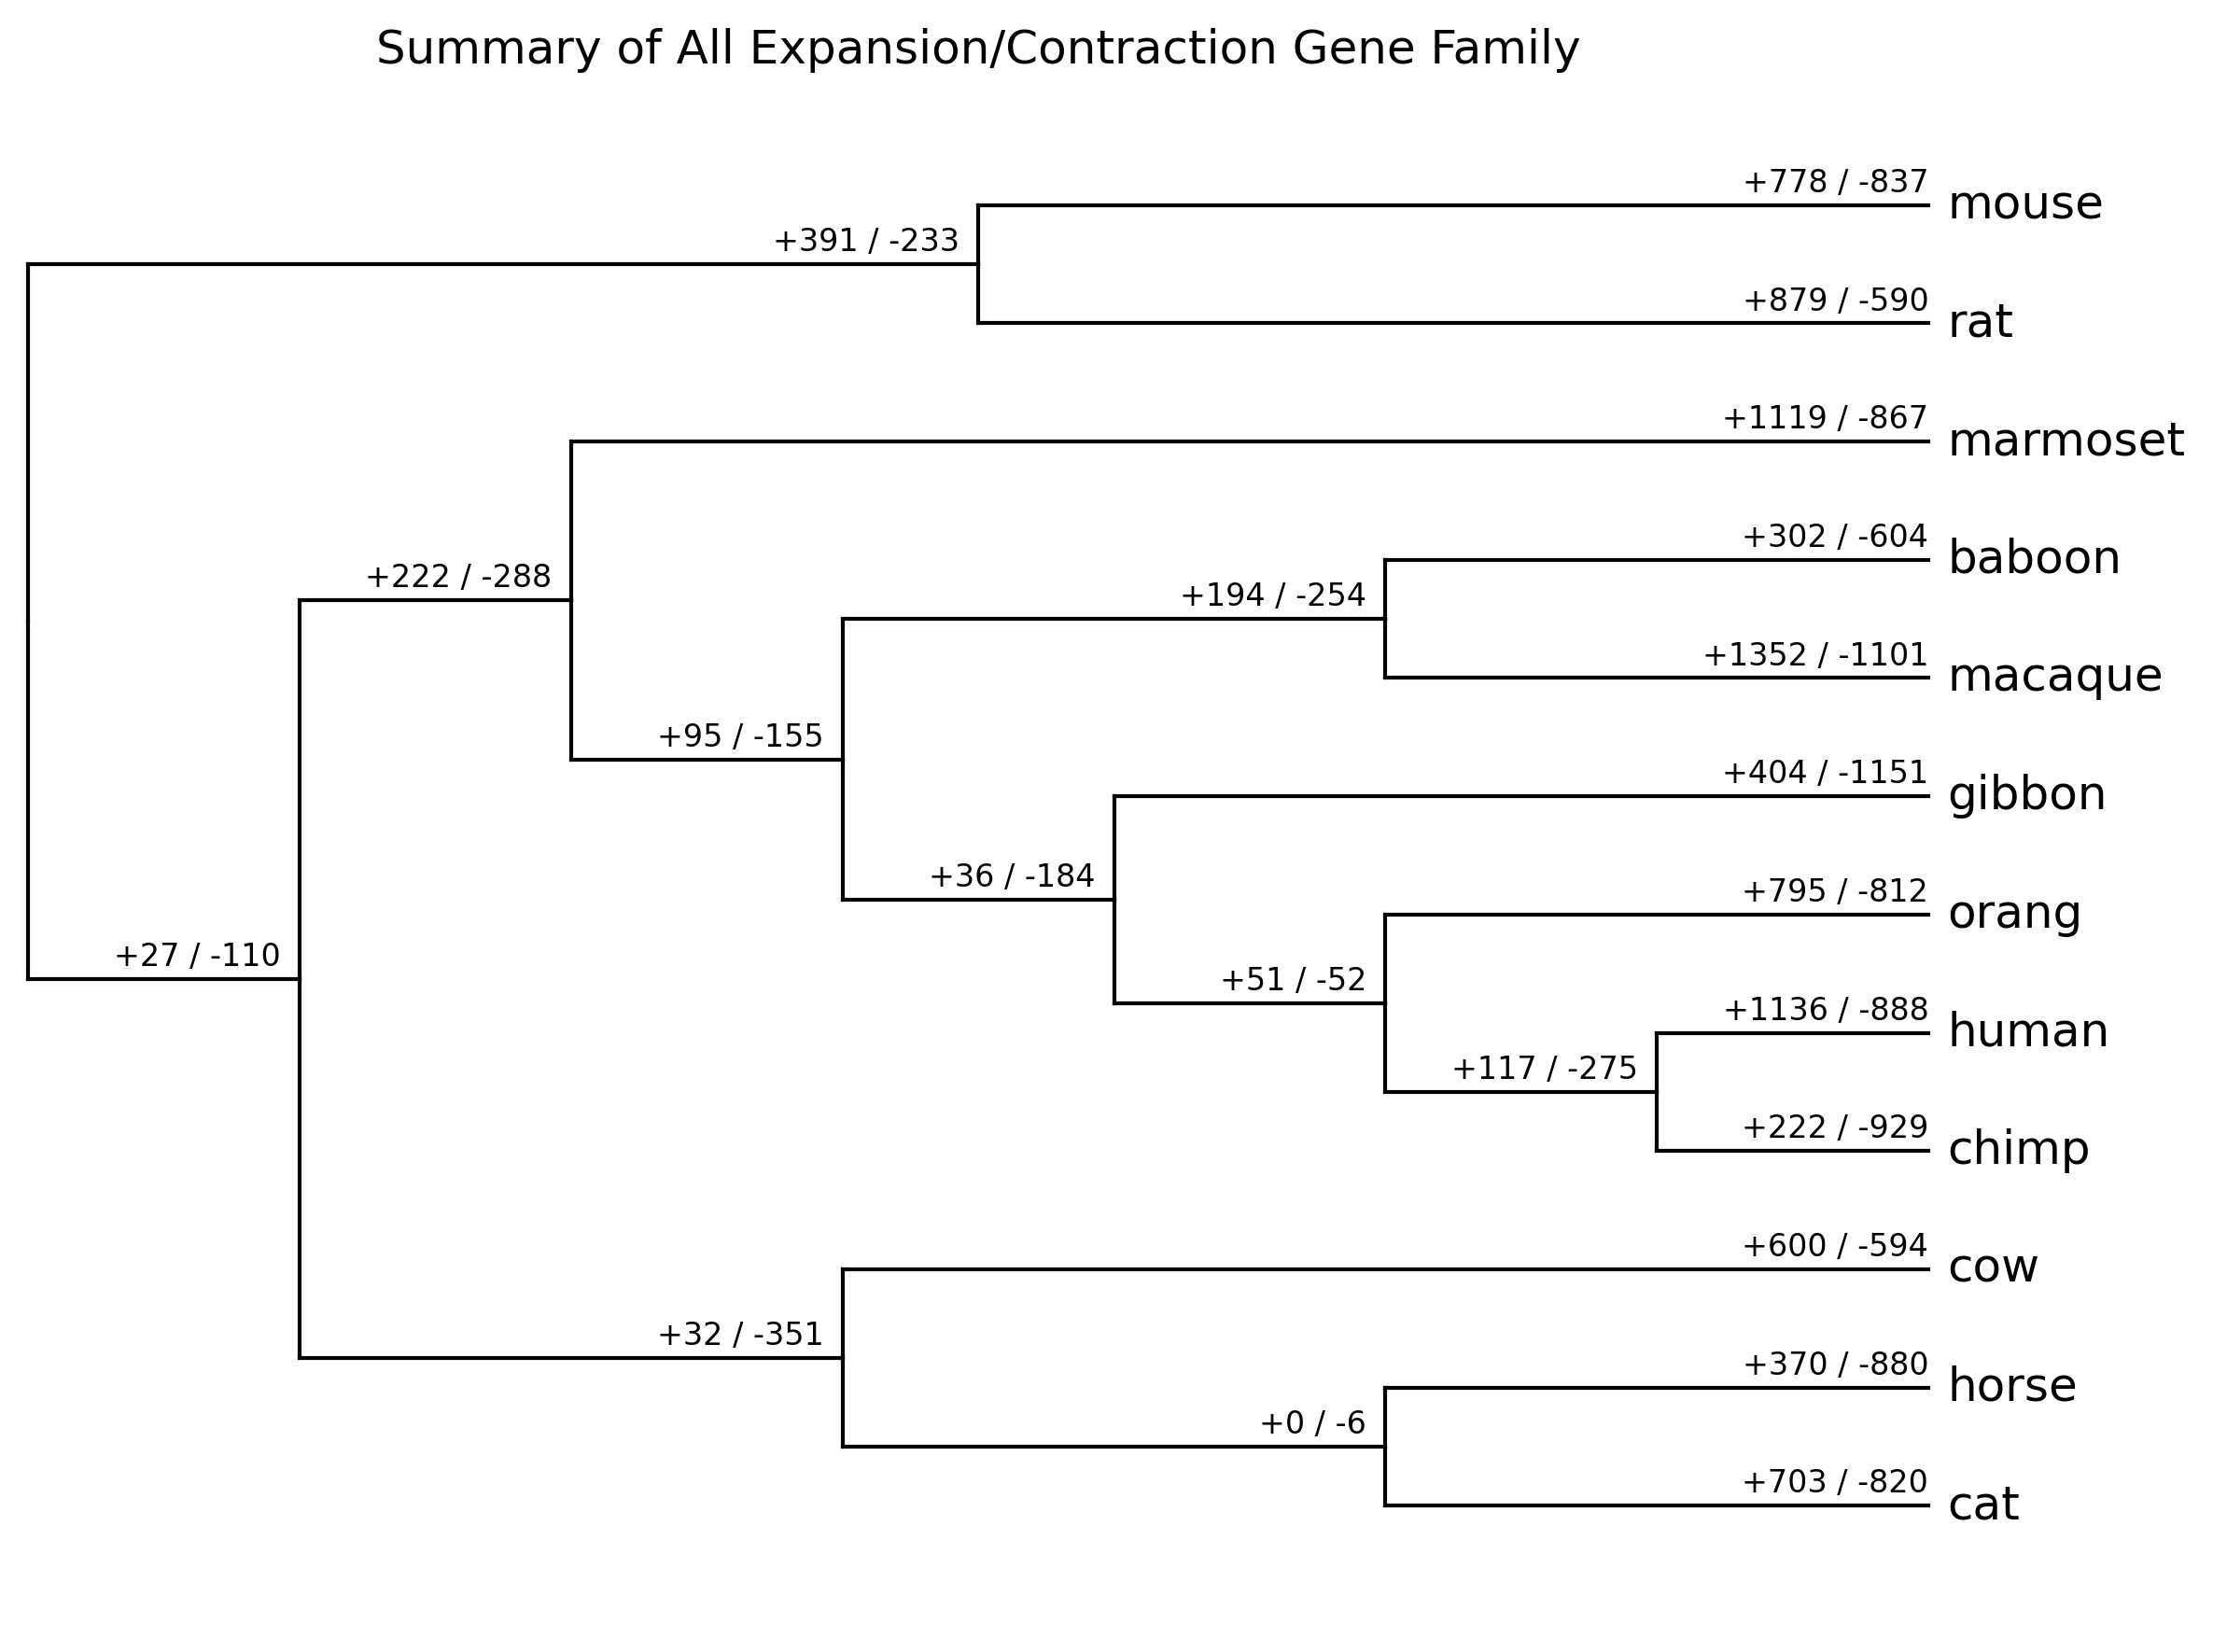
-
gene_family/{FamilyID}_gene_family.[png|jpg|svg|pdf]
Significant expansion(red)/contraction(blue) gene family result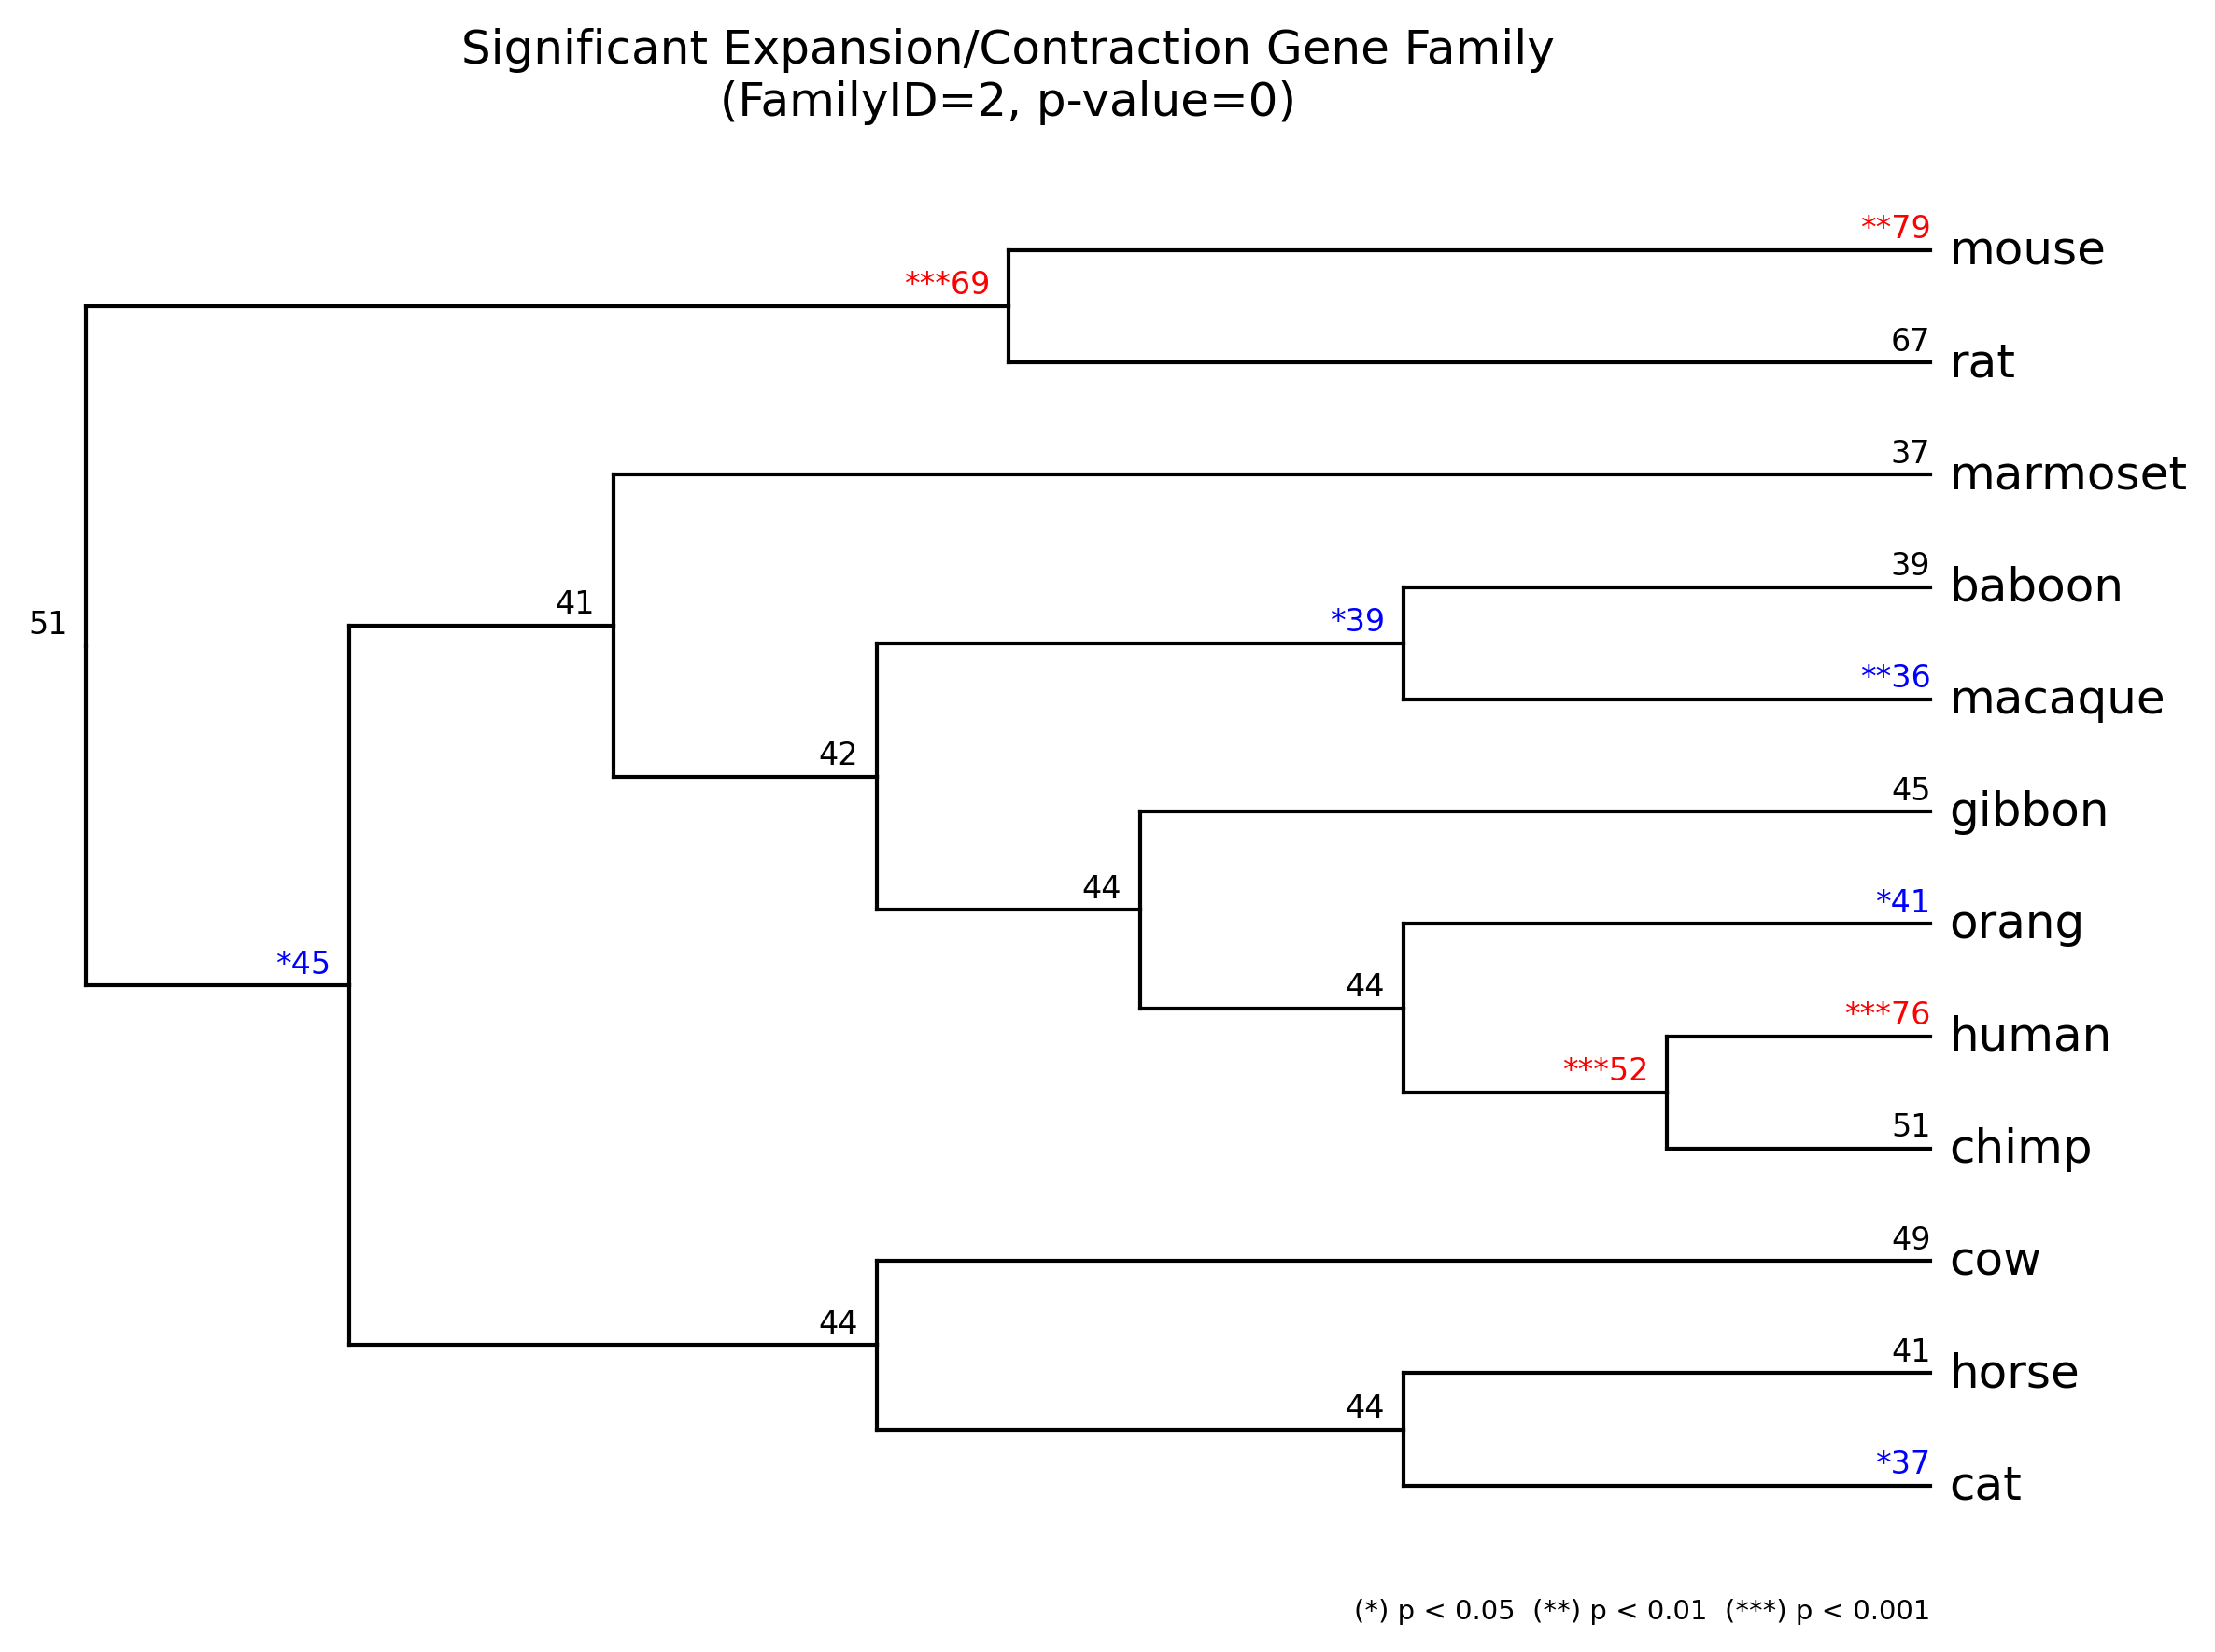
-
result_summary.tsv (example)
Significant expansion/contraction result summary for each family and taxon