This project sets up an Elastic Cluster with 3 nodes using Virtualbox virtual machines. It includes the setup of Elasticsearch, Logstash, and Kibana (ELK stack) for log management and analysis.
- Set up Elastic Cluster with all necessary components.
- Create an index with a retention period of 10 days in Hot, 10 days in Cold, and 10 days in Frozen tiers.
- Load logs using one of the methods listed in the setup.
- Create a Dashboard with drilldown capabilities.
- VirtualBox installed on your system
- Debian 12 ISO image
- Sufficient system resources to run 3 VMs
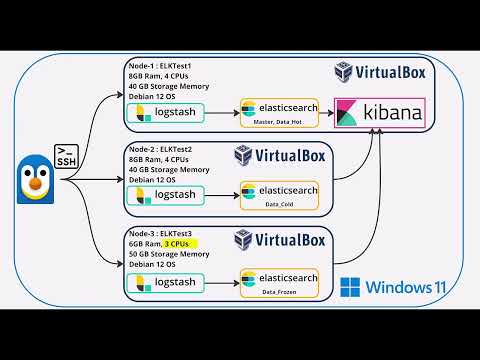
Create 3 VMs with the following specifications:
- elktest1 (Master + Data_Hot + Data_Content, Kibana, Logstash)
- 8 GB RAM, 4 CPU, 40 GB storage
- elktest2 (Data_Cold, Logstash)
- 8 GB RAM, 4 CPU, 40 GB storage
- elktest3 (Data_Frozen, Logstash)
- 6 GB RAM, 3 CPU, 50 GB storage
-
Download Debian 12 ISO:
<https://cdimage.debian.org/debian-cd/current/amd64/iso-cd/debian-12.7.0-amd64-netinst.iso> -
Install Debian on each VM.
-
In VM settings, change network from NAT to Bridged Adapter.
Install SSH on each VM:
su - apt-get update apt-get install openssh-server systemctl start ssh systemctl enable sshReboot and get IP addresses:
reboot now ip addr showConnect from host machine:
ssh <username>@<your_ip_address>On all VMs:
apt install curl curl -fsSL <https://artifacts.elastic.co/GPG-KEY-elasticsearch> | gpg --dearmor -o /usr/share/keyrings/elastic.gpg echo "deb [signed-by=/usr/share/keyrings/elastic.gpg] <https://artifacts.elastic.co/packages/8.x/apt> stable main" | tee -a /etc/apt/sources.list.d/elastic-8.x.list apt update apt install elasticsearch-
Edit
/etc/elasticsearch/elasticsearch.yml:cluster.name: elktestcluster node.name: elktest1 node.roles: ["master","data_hot","data_content"] cluster.initial_master_nodes: ["elktest1"] path.data: /var/lib/elasticsearch path.logs: /var/log/elasticsearch network.host: 0.0.0.0 http.port: 9200 discovery.seed_hosts: ["elktest1"] xpack.security.enabled: true xpack.security.enrollment.enabled: true xpack.security.http.ssl: enabled: true keystore.path: certs/http.p12 xpack.security.transport.ssl: enabled: true verification_mode: certificate keystore.path: certs/transport.p12 truststore.path: certs/transport.p12 http.host: 0.0.0.0
-
Start Elasticsearch:
systemctl start elasticsearch
-
Reset elastic user password:
/usr/share/elasticsearch/bin/elasticsearch-reset-password -i -u elastic
-
Generate enrollment tokens for other nodes:
cd /usr/share/elasticsearch/bin ./elasticsearch-create-enrollment-token -s node
-
Reconfigure node with enrollment token:
cd /usr/share/elasticsearch/bin ./elasticsearch-reconfigure-node --enrollment-token <your_enrollment_token>
-
Edit
/etc/elasticsearch/elasticsearch.yml:For elktest2:
cluster.name: elktestcluster node.name: elktest2 node.roles: ["data_cold"] path.data: /var/lib/elasticsearch path.logs: /var/log/elasticsearch network.host: 0.0.0.0 http.port: 9200
For elktest3:
cluster.name: elktestcluster node.name: elktest3 node.roles: ["data_frozen"] path.data: /var/lib/elasticsearch path.logs: /var/log/elasticsearch network.host: 0.0.0.0 http.port: 9200 xpack.searchable.snapshot.shared_cache.size: 30%
-
Start Elasticsearch on both nodes:
systemctl start elasticsearch
Create ILM policy:
PUT _ilm/policy/elktestcluster_logs_policy { "policy": { "phases": { "hot": { "actions": { "rollover": { "max_size": "40gb", "max_age": "10d" } } }, "warm": { "min_age": "10d", "actions": { "forcemerge": { "max_num_segments": 1 }, "allocate": { "require": { "data": "cold" } } } }, "cold": { "min_age": "20d", "actions": { "freeze": {}, "allocate": { "require": { "data": "frozen" } } } } } } }Assign policy to index template:
PUT _index_template/elktestcluster_logs_template { "index_patterns": ["elktestcluster-logs-*"], "template": { "settings": { "number_of_shards": 1, "number_of_replicas": 1, "index.lifecycle.name": "elktestcluster_logs_policy", "index.lifecycle.rollover_alias": "elktestcluster-logs" } } }Install Logstash on all VMs:
apt install logstash -yAdd logstash user to elasticsearch group:
sudo usermod -aG elasticsearch logstashCreate Logstash pipeline configuration:
nano /etc/logstash/conf.d/elktestcluster-logs.conAdd the following content:
input { file { path => [ "/var/log/elasticsearch/elktestcluster*.json" ] start_position => "beginning" sincedb_path => "/dev/null" codec => "json" } } output { elasticsearch { hosts => ["<https://elktest1:9200>", "<https://elktest2:9200>", "<https://elktest3:9200>"] index => "elktestcluster-logs-%{+YYYY.MM.dd}" user => "elastic" password => "elastic" ssl => true cacert => "/etc/elasticsearch/certs/http_ca.crt" } } Start Logstash on all VMs:
systemctl start logstashInstall Kibana on one VM (preferably elktest1 or elktest2):
apt install kibana -yReset kibana_system user password:
/usr/share/elasticsearch/bin/elasticsearch-reset-password -i -u kibana_systemConfigure Kibana:
nano /etc/kibana/kibana.ymlAdd/edit the following:
server.port: 5601 server.host: "0.0.0.0" elasticsearch.hosts: ["<https://elktest1:9200>", "<https://elktest2:9200>", "<https://elktest3:9200>"] elasticsearch.username: "kibana_system" elasticsearch.password: "kibana" elasticsearch.ssl.verificationMode: noneStart Kibana:
systemctl start kibanaOpen a web browser and go to:
http://<your_kibana_machine_ip>:5601 Use the Elasticsearch credentials:
- Username: elastic
- Password: elastic
- Create a data view from cluster logs in Kibana.
- Create a dashboard from the data view.

Congratulations! You have now set up a complete ELK stack for log management and analysis.