Skip to content

Conversation

@eyalkoren
Copy link
Contributor

@eyalkoren eyalkoren commented Dec 28, 2020

What does this PR do?

Initial attempt to fix a sampling profiler's memory leak reported at the forum.

@ghost
Copy link

ghost commented Dec 28, 2020

💚 Build Succeeded

the below badges are clickable and redirect to their specific view in the CI or DOCS
Pipeline View Test View Changes Artifacts preview

Expand to view the summary

Build stats

  • Build Cause: Pull request #1592 updated

  • Start Time: 2021-01-07T09:19:59.367+0000

  • Duration: 42 min 12 sec

Test stats 🧪

Test Results
Failed 0
Passed 1685
Skipped 12
Total 1697

💚 Flaky test report

Tests succeeded.

Expand to view the summary

Test stats 🧪

Test Results
Failed 0
Passed 1685
Skipped 12
Total 1697

@felixbarny
Copy link
Member

Another idea that's probably worth implementing in addition to this: only hold soft (not weak) references to call tree roots. This doesn't fix the root cause but mitigates the severeness of the symptom. Basically another safety net.

@eyalkoren
Copy link
Contributor Author

Another idea that's probably worth implementing in addition to this: only hold soft (not weak) references to call tree roots. This doesn't fix the root cause but mitigates the severeness of the symptom. Basically another safety net.

Good idea! I had a thought in the same direction with regard to the profiledThreads map - what happens if the application kills and replaces threads within a pool frequently and the configurations dictates continuous profiling (which is the default)? Then we will accumulate call trees in the map and clearProfiledThreads won't be called unless there is an error during profiling.
I only focus in profiledThreads map, because it is the only thing I found that holds roots, besides the root pool, which I don't assume you referred to (if so, this should be done generically through the object pooling infrastructure).

One more thought I have is to connect the SamplingProfiler (actually the ProfilingFactory) to the circuit breaker mechanism - we only need to clear everything in pause because the profiler is noop when the tracer is PAUSED.

I will do some more additional cosmetic recycling changes to the recycling flows.

@eyalkoren
Copy link
Contributor Author

Now that I started implementing the cache, I saw that it we would need to allocate a SoftReference every time we start a new stack analysis. So it feels odd to pool root objects and still allocate every time...
I will think about it some more. One option is to keep entries in profiledThreads when finishing stack analysis and keep track of their usage (number of iterations since last used or timestamp since last used etc.) and expunge them when we decide they are stale, but that may be an overkill.
For now I am adding the other stuff.

@codecov-io
Copy link

codecov-io commented Dec 31, 2020

Codecov Report

Merging #1592 (8f5eab6) into master (56cc3b8) will decrease coverage by 7.96%.
The diff coverage is 74.19%.

Impacted file tree graph

@@ Coverage Diff @@ ## master #1592 +/- ## ============================================ - Coverage 66.68% 58.72% -7.97%  + Complexity 3021 92 -2929  ============================================ Files 282 399 +117 Lines 14165 17864 +3699 Branches 1922 2475 +553 ============================================ + Hits 9446 10490 +1044  - Misses 4065 6649 +2584  - Partials 654 725 +71 
Impacted Files Coverage Δ Complexity Δ
...o/elastic/apm/agent/profiler/SamplingProfiler.java 73.28% <72.00%> (+0.55%) 0.00 <0.00> (-60.00) ⬆️
...n/java/co/elastic/apm/agent/profiler/CallTree.java 92.25% <83.33%> (-0.21%) 0.00 <0.00> (-100.00)
...ration/source/PropertyFileConfigurationSource.java 35.52% <0.00%> (-41.62%) 0.00% <0.00%> (-11.00%)
...nt/configuration/converter/ListValueConverter.java 43.47% <0.00%> (-39.86%) 0.00% <0.00%> (-4.00%)
...c/main/java/co/elastic/apm/agent/util/IOUtils.java 56.60% <0.00%> (-34.31%) 0.00% <0.00%> (-16.00%)
...tion/source/SystemPropertyConfigurationSource.java 23.07% <0.00%> (-26.93%) 0.00% <0.00%> (-3.00%)
...tic/apm/agent/jsf/JsfLifecycleInstrumentation.java 0.00% <0.00%> (ø) 0.00% <0.00%> (?%)
.../agent/dubbo/advice/ApacheMonitorFilterAdvice.java 11.11% <0.00%> (ø) 0.00% <0.00%> (?%)
.../agent/kafka/helper/KafkaRecordHeaderAccessor.java 0.00% <0.00%> (ø) 0.00% <0.00%> (?%)
.../main/java/co/elastic/apm/opentracing/ApmSpan.java 70.83% <0.00%> (ø) 20.00% <0.00%> (?%)
... and 113 more

Continue to review full report at Codecov.

Legend - Click here to learn more
Δ = absolute <relative> (impact), ø = not affected, ? = missing data
Powered by Codecov. Last update 56cc3b8...8f5eab6. Read the comment docs.

@eyalkoren
Copy link
Contributor Author

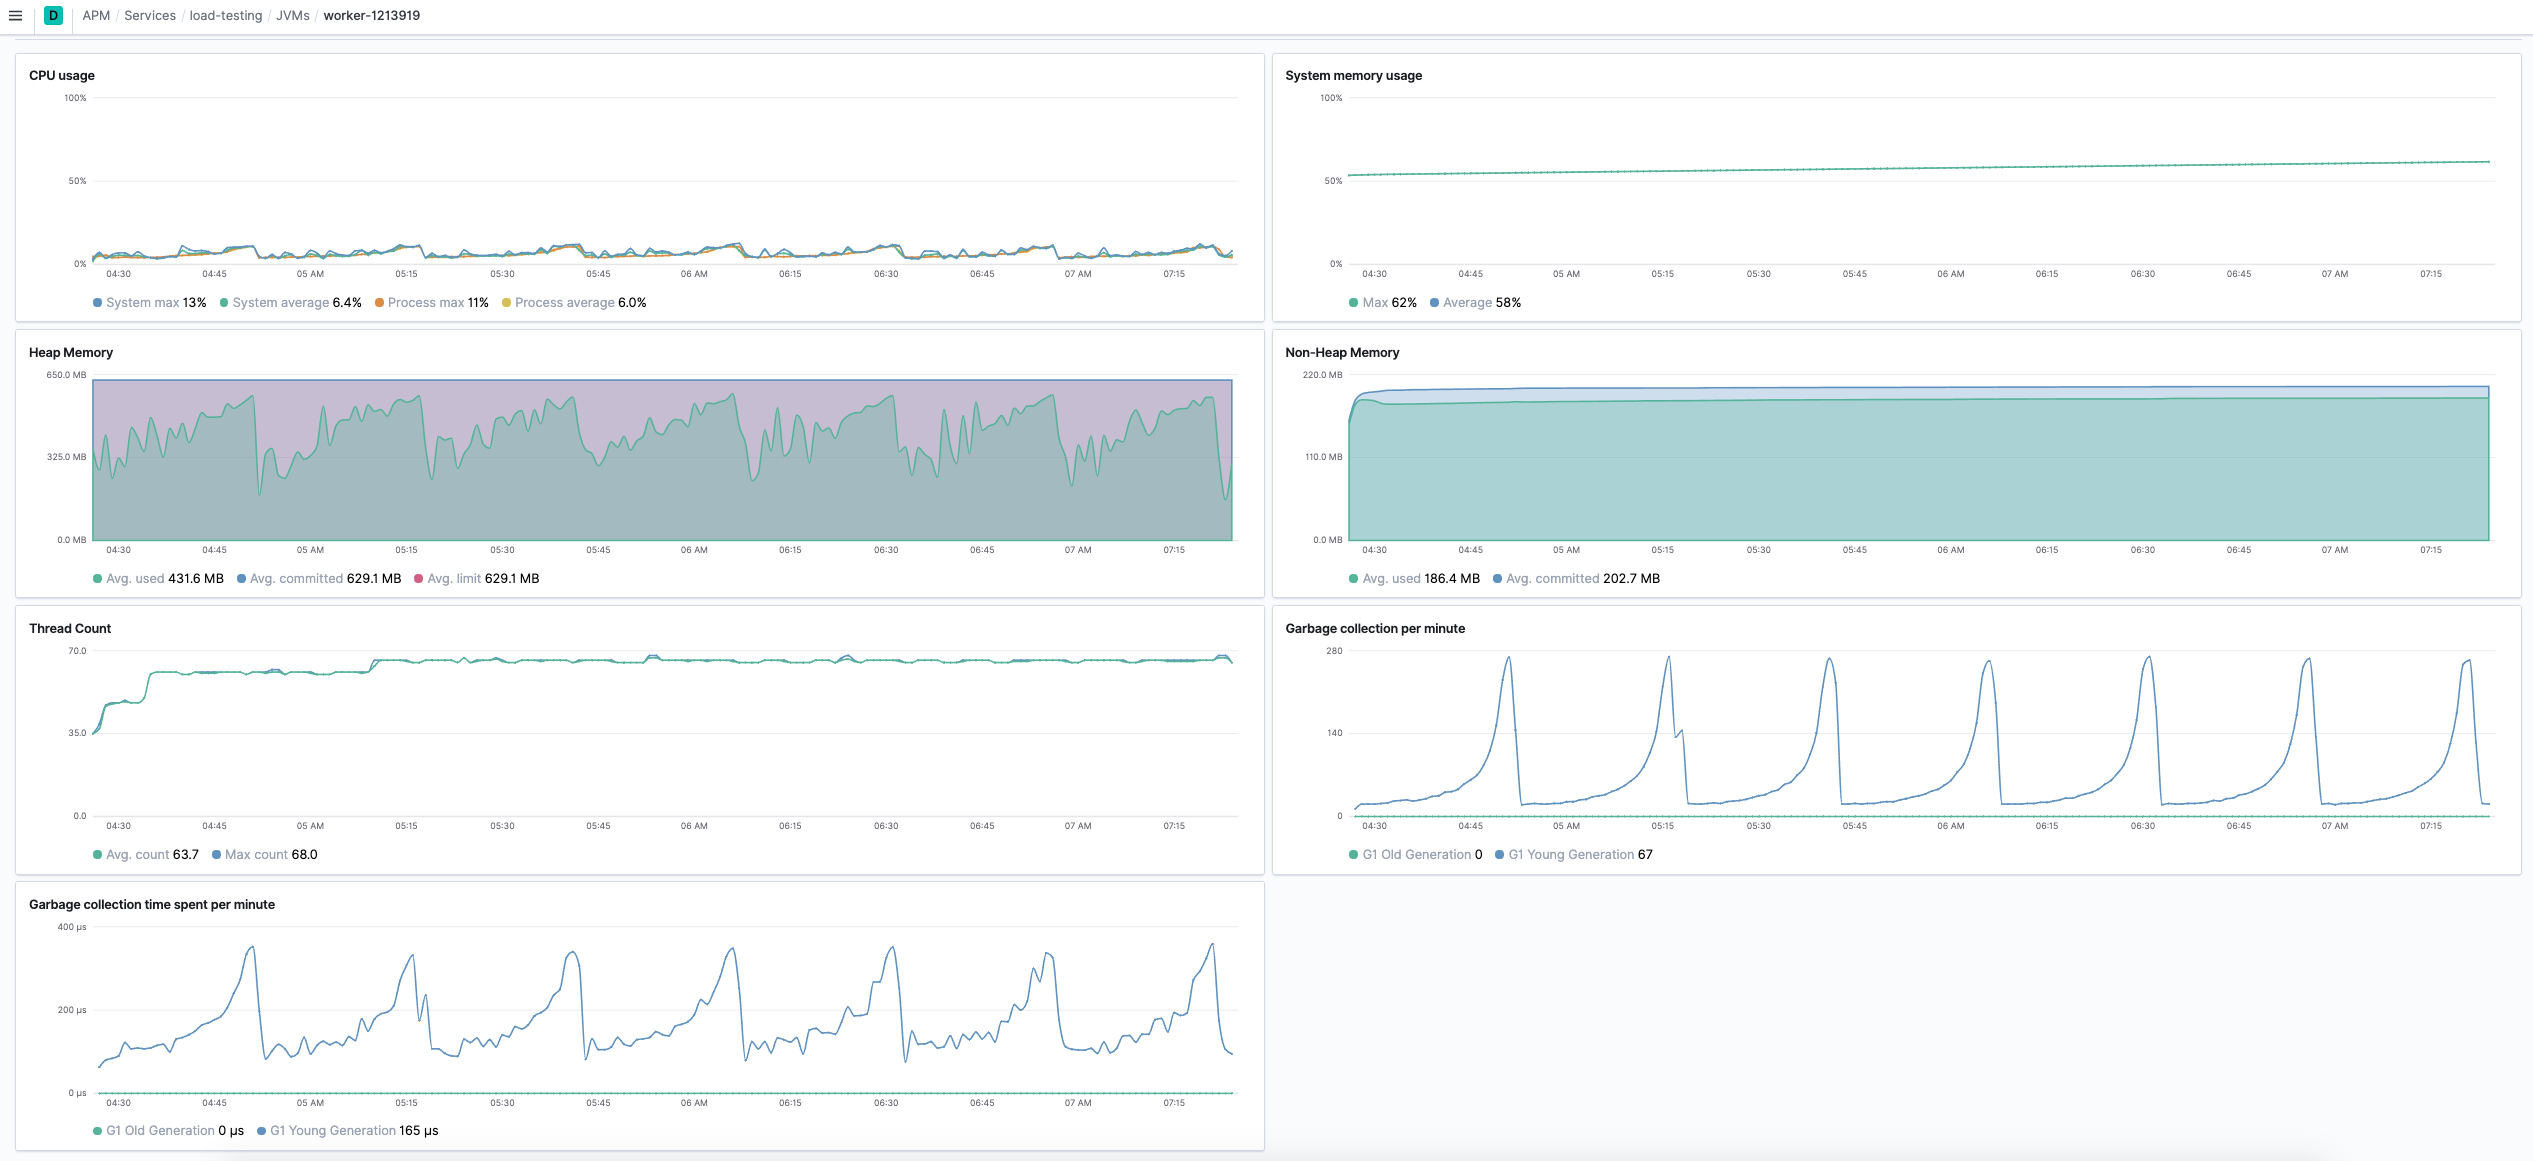
I added a deliberate memory leak through profiledThreads and verified that the circuit breaker is cleaning this leak as expected:
Screen Shot 2021-01-03 at 9 13 55

@eyalkoren eyalkoren requested a review from felixbarny January 3, 2021 07:30
Copy link
Member

@SylvainJuge SylvainJuge left a comment

Choose a reason for hiding this comment

The reason will be displayed to describe this comment to others. Learn more.

[question] would it make sense to have all tree nodes keep a reference to their respective pools (root nodes and others) so that recycling would always be done to the right pool ?

@eyalkoren eyalkoren force-pushed the call-tree-memory-leak branch from 9f92605 to c81c3d1 Compare January 7, 2021 07:32
@eyalkoren eyalkoren requested a review from SylvainJuge January 7, 2021 07:35
@eyalkoren eyalkoren force-pushed the call-tree-memory-leak branch from caba3d6 to 8f5eab6 Compare January 7, 2021 09:19
@eyalkoren eyalkoren merged commit 1039db0 into elastic:master Jan 7, 2021
@eyalkoren eyalkoren deleted the call-tree-memory-leak branch January 7, 2021 10:23
Sign up for free to join this conversation on GitHub. Already have an account? Sign in to comment

4 participants