online stock pricing and plotting Business Proposal
As a data analyst in an equity investment company, you are tasked to understand the rising needs of clients to compare the performances through the Relative Strength Index (RSI) of different stocks.
Software Specifications
There is a need to build a charting software application on Jupyter Notebook that addresses the needs of the investment clients as shown.
The investment clients must be given the following options:
- Decide on the number of stocks between 1 to 10 stocks that they want to review
- Select the required stocks based on their ticker value accordingly a. For simplicity, these are 10 stocks which they should choose from accordingly ["FB", "AAPL", "AMZN", "IBM", "GOOGL", "MSFT", "NAV", "O", "QCOM", "TSLA"] The stocks can differ from the above 10 but please ensure that there is stock price data from 1st Jan 2010 to 31st Dec 2017 for the stocks that have been selected accordingly
- The software should use an API provider and retrieve the daily “Close” price for each equity from 1st Jan 2010 to 31st Dec 2017 a. The preferred API provider is www.rapidapi.com but you are free to choose any open source provider
- The software should then compute the RSI of the selected stocks with the following options: a. The user can decide the between two methods i. Exponential Weighted Moving Average ii. Smooth Moving Average b. The user can set the Moving Window range value (usually 14) c. The user to customize the duration for plotting of the starting and finishing date
- The software should then plot the charts with the following configuration options: a. The different stock RSIs should be in different colour b. There should be a legend explaining the various stock references The creation of dynamic interactive charts is encouraged, but not compulsory for this assignment specifications.
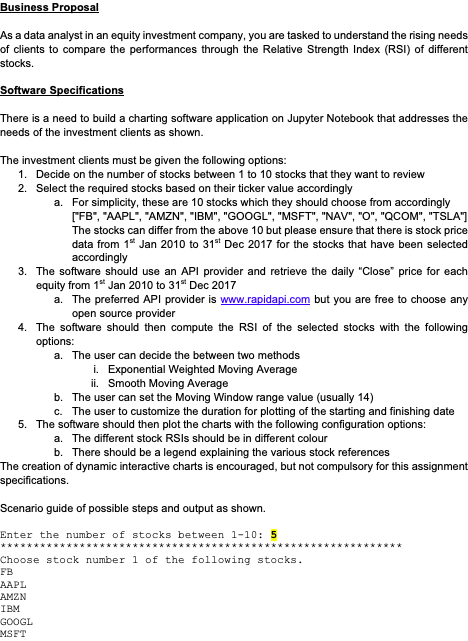
Scenario guide of possible steps and output as shown.
Enter the number of stocks between 1-10: 5
Choose stock number 1 of the following stocks. FB AAPL AMZN IBM GOOGL MSFT NAV O QCOM TSLA
Enter your stock: FB
Choose stock number 2 of the following stocks. AAPL AMZN IBM GOOGL MSFT NAV O QCOM TSLA
Enter your stock: AAPL
Choose stock number 3 of the following stocks. AMZN IBM GOOGL MSFT NAV O QCOM TSLA
Enter your stock: GOOGL
Choose stock number 4 of the following stocks. AMZN IBM MSFT NAV O QCOM TSLA
Enter your stock: MSFT
Choose stock number 5 of the following stocks. AMZN IBM NAV O QCOM TSLA
Enter your stock: TSLA Please whether you would like to use the EWMA or SMA to compute the Relative Strength Index value: EWMA Please enter the Moving Window range: 14 Please enter a start date for the chart between 2010-01-01 and 2017-12-31 , in the format YYYY-MM-DD, here: 2014-12-31 Please enter a finish date for the chart between 2014-12-31 and 2017-12-31 , in the format YYYY-MM-DD, here: 2017-12-31
The scenario reference is to provide a guideline on how the application can be portrayed but does not need to be exactly the same and is only a reference guide for completeness.
- SUBMISSION
Each individual to submit one (1) softcopy of the Jupyter Notebook. Include visuals, comments, diagrams and/or tables, where appropriate, to enhance your charting software application.
Remove any unauthorized information such as API keys which are sensitive information that contains user specific credentials.