
파일:Temp-sunspot-co2.svg

SVG 파일의 PNG 형식의 미리보기 크기: 768 × 576 픽셀. 다른 해상도: 320 × 240 픽셀 | 640 × 480 픽셀 | 1,024 × 768 픽셀 | 1,280 × 960 픽셀 | 2,560 × 1,920 픽셀
원본 파일 (SVG 파일, 실제 크기 768 × 576 픽셀, 파일 크기: 100 KB)
파일 설명
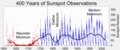
| 설명 | English: Global average temperature, atmospheric CO2, and sunspot activity since 1850. Thick lines for temperature and sunspots represent a 25 year LOWESS and moving average smoothing of the raw data. | ||
| 날짜 | 2009년 1월 11일 (원본 올리기 일시) | ||
| 출처 | Anrie 사용자가 CommonsHelper 도구를 사용하여 en.wikipedia에서 공용으로 옮겨왔습니다. | ||
| 저자 | 영어 위키백과의 Leland McInnes | ||
| 다른 버전 |
| ||
| SVG 발전 | #(light blue) Law Dome CO2 Data: ftp://ftp.ncdc.noaa.gov/pub/data/paleo/icecore/antarctica/law/law_co2.txt
Global average temperature, atmospheric CO2, and sunspot activity since 1850. Thick lines for temperature and sunspots represent a 25 year moving average smoothing of the raw data. This figure was produced by Leland McInnes using python and matplotlib and is licensed under the GFDL. All data is from publicly available sources.
| ||
| 소스 코드 | Python code#! /usr/bin/env python3 # -*- coding: utf-8 -*- import numpy as np import matplotlib.pylab as plt import matplotlib.ticker as ticker import urllib3 import ftplib import shutil plt.rcdefaults() plt.style.use('classic') def saveurl(url, fname): if url.startswith("ftp"): ftp = ftplib.FTP('/'.join(url.split('/')[2:3])) ftp.login('', '') with open(fname, 'wb') as f: res = ftp.retrbinary('RETR %s' % '/'.join(url.split('/')[3:]), f.write) else: c = urllib3.PoolManager() with c.request('GET', url, preload_content=False) as resp, open(fname, 'wb') as out_file: shutil.copyfileobj(resp, out_file) print('saved', fname, 'from', url) def smooth_convolution(signal, window_size): window_size = 1 + 2 * (window_size // 2) # should be odd w = np.hamming(window_size) y = (np.convolve(w, signal) / np.convolve(w, np.ones_like(signal))) return y[(len(w)-1)//2:-(len(w)//2)] def smooth_boxcar(signal, window_size): w = np.ones(window_size) return np.convolve(w, signal, mode="valid") / window_size def smooth_lowess(signal, window_size): s = window_size // 2 window = np.hamming(1+2*s) / np.hamming(1+2*s).sum() smoothed = np.empty_like(signal) for i in range(len(signal)): i0, i1 = max(i-s, 0), min(i+s, len(signal)-1) + 1 # linear LOWESS smoothing smoothed[i] = np.poly1d(np.polyfit(np.arange(i0, i1), signal[i0:i1], deg=1, w=np.sqrt(window[i0-i+s:i1-i+s])))(i) return smoothed saveurl("https://crudata.uea.ac.uk/cru/data/temperature/HadCRUT5.1Analysis_gl.txt", "hadcrut5gl.txt") with open("hadcrut5gl.txt") as temp_file: temp_years, temps = [], [] last_year = None for l in temp_file.readlines(): yT = l.split() if (not l.startswith('#')) and len(yT) > 1: year = float(yT[0]) if year != last_year: temp_years += [year + (0.5 + i) / 12. for i in range(len(yT) - 2)] temps += [float(T) for T in yT[1:13]] last_year = year temp_years = smooth_boxcar(temp_years, 12) temps = smooth_boxcar(temps, 12) #print('T', list(zip(temp_years, temps))) saveurl("ftp://aftp.cmdl.noaa.gov/products/trends/co2/co2_mm_mlo.txt", "co2_mm_mlo.dat") with open("co2_mm_mlo.dat") as co2_file: data_rows = [x.split() for x in co2_file if not x.startswith("#") and x.find("-99.99") == -1] co2_years = [float(x[2]) for x in data_rows] co2concs = [float(x[3]) for x in data_rows] #print('co2', list(zip(co2_years, co2concs))) saveurl("ftp://ftp.ncdc.noaa.gov/pub/data/paleo/icecore/antarctica/law/law_co2.txt", "law_co2.txt") with open("law_co2.txt", encoding="ISO-8859-1") as lawco2_file: data_rows = [x.split() for x in lawco2_file if x.startswith(" 1")] del data_rows[ [float(x[0]) for x in data_rows].index(1010.):] lawco2_years = [float(x[0]) for x in data_rows] lawco2concs = [float(x[-1]) for x in data_rows] #print('lawco2', list(zip(lawco2_years, lawco2concs))) saveurl("http://www.sidc.be/silso/DATA/SN_y_tot_V2.0.txt", "yearssn.dat") with open("yearssn.dat") as sunspot_file: data_rows = [x.split() for x in sunspot_file if "*" not in x] sun_years = [float(x[0]) for x in data_rows] sunspots = [float(x[1]) for x in data_rows] #print('sunspots', list(zip(sun_years, sunspots))) t_min, t_max = 1850, max(temp_years[-1], co2_years[-1], sun_years[-1]) smoothed_temps = smooth_lowess(temps, 25 * 12) smoothed_sunspots = smooth_convolution(sunspots, 25) rect = [0.125, 0.1, 0.775, 0.8] base_ax = plt.axes(rect) base_ax.yaxis.tick_left() plt.yticks([]) plt.xlim(t_min, t_max) plt.gca().xaxis.set_major_locator(ticker.MultipleLocator(20)) plt.xlabel("Year", size=16) plt.title(r"Temperature, CO$_2$, and Sunspots", size=22) temp_ax = plt.axes([rect[0],rect[1]+.42*rect[3],rect[2],.58*rect[3]], frameon=False) temp_ax.yaxis.tick_left() plt.plot(temp_years, temps, '#FF2200') tline = plt.plot(temp_years, smoothed_temps, '#AA0000', lw=3) plt.xlim(t_min, t_max) plt.ylim(min(temps)*1.03 - 0.03*max(temps), max(temps)*1.03 - 0.03*min(temps)) plt.yticks(np.arange(-0.6, 1.3, 0.2)) plt.ylabel(u'Temperature anomaly (°C)', size=14, color='#AA0000') plt.xticks([]) co2_ax = plt.axes([rect[0],rect[1]+.25*rect[3],rect[2],.5*rect[3]], frameon=False) co2_ax.yaxis.tick_right() co2_ax.yaxis.set_label_position("right") co2_ax.xaxis.tick_bottom() plt.plot(co2_years, co2concs, '#44AAFF') cline = plt.plot(lawco2_years, lawco2concs, '#2288EE', lw=2) plt.xlim(t_min, t_max) plt.ylabel(r'CO$_2$ (ppm)', size=14, color='#2288EE') plt.xticks([]) sun_ax = plt.axes([rect[0],rect[1],rect[2],.5*rect[3]], frameon=False) sun_ax.yaxis.tick_left() plt.plot(sun_years, sunspots, "#FFDD00") sline = plt.plot(sun_years, smoothed_sunspots, "#FF9900", lw=3) plt.xlim(t_min, t_max) plt.yticks(np.arange(0,250,50)) plt.ylabel("Sunspot number", size=14, color='#FF9900') plt.xticks([]) plt.sca(base_ax) t_proxy = plt.Line2D([0], [0], c='#AA0000', lw=3) c_proxy = plt.Line2D([0], [0], c='#2288EE', lw=3) s_proxy = plt.Line2D([0], [0], c='#FF9900', lw=3) plt.legend((t_proxy, c_proxy, s_proxy), ("Temperature", r"CO$_2$", "Sunspots"), loc="upper left") plt.savefig("Temp-co2-sunspot.svg") plt.show() |


Related Images


라이선스
Leland McInnes (영어 위키백과 사용자)은(는) 아래 작품의 저작권자로서, 해당 저작물을 다음과 같은 라이선스로 배포합니다:
| 이 파일은 크리에이티브 커먼즈 저작자표시-동일조건변경허락 3.0 Unported 라이선스로 배포됩니다. 면책 조항이 적용됩니다. | ||
| 저작자표시: Leland McInnes (영어 위키백과 사용자) | ||
| ||
| 이 라이선스 틀은 GFDL 라이선스 변경의 일부로 이 파일에 추가되었습니다. |
 | GNU 자유 문서 사용 허가서 1.2판 또는 자유 소프트웨어 재단에서 발행한 이후 판의 규정에 따라 본 문서를 복제하거나 개작 및 배포할 수 있습니다. 본 문서에는 변경 불가 부분이 없으며, 앞 표지 구절과 뒷 표지 구절도 없습니다. 본 사용 허가서의 전체 내용은 GNU 자유 문서 사용 허가서 부분에 포함되어 있습니다. 면책 조항이 적용됩니다. |
기존 올리기 기록
The original description page was here. All following user names refer to en.wikipedia.
- 2009-01-11 03:45 Leland McInnes 720×540× (102750 bytes)
- 2008-10-09 00:57 Leland McInnes 600×480× (34962 bytes)
- 2007-03-11 02:47 Leland McInnes 600×480× (48910 bytes) Fix for wrong data selection
- 2007-03-11 02:10 Leland McInnes 600×480× (48672 bytes) Update to Had CRUT3 instead of CRUTEM
- 2007-03-10 20:46 Leland McInnes 600×480× (48525 bytes)
- 2007-03-10 20:41 Leland McInnes 600×480× (47761 bytes)
- 2007-03-10 05:01 Leland McInnes 600×480× (33704 bytes) Global average temperature, Mauna Loa CO<sub>2</sub>, and sunspot activity for the last 50 years.
파일 역사
날짜/시간 링크를 클릭하면 해당 시간의 파일을 볼 수 있습니다.
| 날짜/시간 | 섬네일 | 크기 | 사용자 | 설명 | |
|---|---|---|---|---|---|
| 현재 | 2026년 1월 11일 (일) 20:50 |  | 768 × 576 (100 KB) | Geek3 | update 2026-01 |
| 2026년 1월 8일 (목) 16:36 |  | 756 × 567 (9 KB) | Д.Ильин | Fix 10 errors. Optimization, style | |
| 2022년 5월 31일 (화) 05:23 |  | 720 × 540 (98 KB) | Geek3 | update 2022-04 | |
| 2021년 4월 9일 (금) 22:11 |  | 720 × 540 (106 KB) | Geek3 | update 2021-04 | |
| 2020년 6월 26일 (금) 22:04 |  | 720 × 540 (105 KB) | Geek3 | data update 2020-05, enlarge temperature y-axis | |
| 2020년 3월 7일 (토) 00:10 |  | 720 × 540 (107 KB) | Geek3 | update with 2020 data | |
| 2014년 6월 23일 (월) 07:15 |  | 720 × 540 (76 KB) | Kopiersperre | switch from hadcrut3 to hadcrut4 | |
| 2014년 3월 12일 (수) 05:27 |  | 720 × 540 (62 KB) | Kopiersperre | update | |
| 2012년 6월 26일 (화) 06:04 |  | 731 × 551 (75 KB) | Johnanth | New version pulled from file discussion, based on the newly updated Python script. | |
| 2011년 6월 21일 (화) 03:38 |  | 731 × 551 (69 KB) | Killiondude | http://m8y.org/tmp/wikipedia/ Someone was kind enough to use updated stats and redo it. |
이 파일을 사용하는 문서
다음 문서 3개가 이 파일을 사용하고 있습니다:
이 파일을 사용하고 있는 모든 위키의 문서 목록
다음 위키에서 이 파일을 사용하고 있습니다:
- be.wikipedia.org에서 이 파일을 사용하고 있는 문서 목록
- bn.wikipedia.org에서 이 파일을 사용하고 있는 문서 목록
- ca.wikipedia.org에서 이 파일을 사용하고 있는 문서 목록
- de.wikipedia.org에서 이 파일을 사용하고 있는 문서 목록
- de.wikibooks.org에서 이 파일을 사용하고 있는 문서 목록
- el.wikipedia.org에서 이 파일을 사용하고 있는 문서 목록
- en.wikipedia.org에서 이 파일을 사용하고 있는 문서 목록
- en.wikiversity.org에서 이 파일을 사용하고 있는 문서 목록
- es.wikipedia.org에서 이 파일을 사용하고 있는 문서 목록
- fa.wikipedia.org에서 이 파일을 사용하고 있는 문서 목록
- fr.wikipedia.org에서 이 파일을 사용하고 있는 문서 목록
- hu.wikipedia.org에서 이 파일을 사용하고 있는 문서 목록
- ig.wikipedia.org에서 이 파일을 사용하고 있는 문서 목록
- it.wikipedia.org에서 이 파일을 사용하고 있는 문서 목록
- pt.wikipedia.org에서 이 파일을 사용하고 있는 문서 목록
- ru.wikipedia.org에서 이 파일을 사용하고 있는 문서 목록
- sr.wikipedia.org에서 이 파일을 사용하고 있는 문서 목록
- tr.wikipedia.org에서 이 파일을 사용하고 있는 문서 목록
- uk.wikipedia.org에서 이 파일을 사용하고 있는 문서 목록
- zh.wikipedia.org에서 이 파일을 사용하고 있는 문서 목록