11
$\begingroup$

Let's say I have two samples:

data1 = RandomChoice[DateRange[{2010, 1, 1}, {2010, 4, 31}, "Day"], 100]; data2 = RandomChoice[DateRange[{2010, 5, 1}, {2010, 8, 31}, "Day"], 100]; 

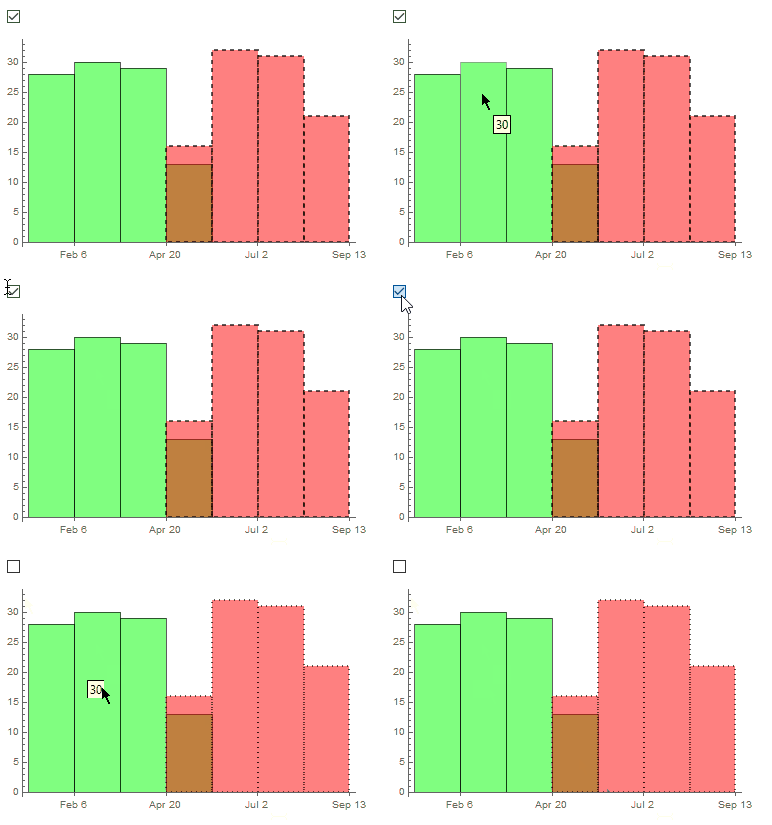
I want to plot a histogram with both of them, and I want data2's bars to have Dotted or Dashed EdgeForm depending of a value of some variable, let's say t.

Problems with available styling options:

  • Dynamic @ DateHistogram[...], recreating it will be too slow for bigger samples.

  • ChartStyle can't be Dynamic or contain it in a list. It can have Directives but they can't contain Dynamic either so it won't work as a wrapper.

  • ChartElementFunction does not allow to distinguish data samples.

  • Histogram* allows certain wrappers for data, e.g. Style: Style[data2, Orange] but it won't allow Dynamic inside

The only way I was able to use is a hairy postprocessing:

t = True; Checkbox @ Dynamic @ t DateHistogram[ {data1, data2}, ChartStyle -> {Green, Red} ] /. d_Directive :> Which[ MemberQ[d, Red, ∞], Dynamic[ Directive[##, EdgeForm[If[TrueQ[t], Dashed, Dotted]]] ] & @@ d , True, d ] 

enter image description here

Is there a more stable/generic way to achieve this?

$\endgroup$
5
  • $\begingroup$ Nested Directives complicate post-processing too much. Why Directive isn't Flat?! I see no reason to keep nested structures of Directives. $\endgroup$ Commented Aug 18, 2016 at 10:15
  • $\begingroup$ @AlexeyPopkov That is another question but can live with this. $\endgroup$ Commented Aug 18, 2016 at 10:17
  • $\begingroup$ Is DateHistogram (which I don't have) necessary for this example or could you be using a Histogram instead? $\endgroup$ Commented Aug 18, 2016 at 11:39
  • $\begingroup$ Sorry, I've got nothing. Alexey's method looks good to me. $\endgroup$ Commented Aug 18, 2016 at 12:32
  • $\begingroup$ @Mr.Wizard in case of Histogram I can use HistogramList to assemble Graphics by myself and have a full control. But for DateHistogram it is not possible :/ HistogramList for DateHistogram? $\endgroup$ Commented Aug 18, 2016 at 12:33

4 Answers 4

3
$\begingroup$

A better post-processing approach

You can use Annotation (or Hyperlink or Button) as a wrapper for the data with a tag as the second argument for simplification of the post-processing:

DateHistogram[{data1, Annotation[data2, myTag]}] /. Annotation[d_, myTag] :> Sequence[Dynamic[EdgeForm[If[TrueQ[t], Dashed, Dotted]]], d] 

This is much simpler and more stable/generic than the method shown in the question, but it still depends on the specifics of the current implementation of DateHistogram.


A hackish solution

Another way is to fool the internal check for validness of style directives by wrapping the tag with Glow (other possibilities: Specularity, RGBColor, Opacity, GrayLevel; checked with Mathematica 11.0.0):

DateHistogram[{data1, data2}, ChartStyle -> {Green, Glow[myTag]}] /. d_Directive /; MemberQ[d, Glow[myTag], ∞] :> Sequence[d /. Glow[myTag] :> {}, Dynamic[EdgeForm[If[TrueQ[t], Dashed, Dotted]]]] 

Shorter version:

DateHistogram[{data1, Style[data2, Glow[myTag]]}] /. Directive[Glow[myTag]] :> Dynamic[EdgeForm[If[TrueQ[t], Dashed, Dotted]]] 

Of course this method potentially can be broken in future if there will be introduced a check for validness of arguments of Glow etc. Hence the method shown in the previous section is preferable.

$\endgroup$
2
$\begingroup$

A worse post-processing approach

I messed around with this for a while and this is the best I could do.

data = RandomVariate[NormalDistribution[#, 3], 100] & /@ {-1, 5}; t = True; Checkbox@Dynamic@t MapAt[ # /. _FEPrivate`If :> EdgeForm[If[t, Dashed, Dotted]] &, Histogram[data, ChartStyle -> {Green, Red}], {1, 1, 2, 2} ] 

The second 2 in {1, 1, 2, 2} may be changed to target the styling. Hey, I said it was worse. :^)

YAPPM

(Yet another post-processing method.) The same thing you did but less focused.

Histogram[data, ChartStyle -> {Green, Red}] /. x_Directive :> Dynamic[x] /. x : Red :> {x, EdgeForm[If[t, Dashed, Dotted]]} 
$\endgroup$
4
  • $\begingroup$ Look out for PerformanceGoal -> "Speed" too. $\endgroup$ Commented Aug 18, 2016 at 13:26
  • $\begingroup$ @Kuba Yes, I'm sure this is quite fragile. :-( $\endgroup$ Commented Aug 18, 2016 at 13:26
  • 1
    $\begingroup$ @Mr.Wizard Thank you for posting this answer! I won't upvote it but I express thanks because I was much wondered whether there is a straightforward way to solve this problem. Now I'm sure there is no way and the reason is clear: Directive doesn't accept Dynamic style directives. But WHY? I don't see any reason for this! $\endgroup$ Commented Aug 18, 2016 at 13:48
  • 1
    $\begingroup$ @Alexey I don't know; it doesn't seem to be easy to get an answer to questions like that. I am glad you found something in this answer useful; I regularly find your answers quite enlightening. $\endgroup$ Commented Aug 18, 2016 at 13:57
2
$\begingroup$

You could specify the low-level parameter of the Dashing:

t = Small; Checkbox[Dynamic[t], {Small, 0}] DateHistogram[{data1, Style[data2, EdgeForm[Dashing[{Dynamic@t, Small}]]]}] 
$\endgroup$
3
  • $\begingroup$ +1 Nice, sadly it is not general :(, e.g. controlling colors. $\endgroup$ Commented Sep 2, 2016 at 5:36
  • $\begingroup$ @Kuba not sure if I understand you correctly. ChartStyle -> {Green, Red} can still be added as an option for DateHistogram. $\endgroup$ Commented Sep 2, 2016 at 19:48
  • $\begingroup$ I meant to link it dynamically to e.g ColorSetter. $\endgroup$ Commented Sep 2, 2016 at 20:05
1
$\begingroup$

You may apply Dynamic to the entire DateHistogram.

Checkbox[Dynamic@t, {Dashed, Dotted}] 

Then

Dynamic@DateHistogram[{data1, data2}, ChartStyle -> {Green, Directive@{Red, EdgeForm[t]}}] 

Hope this helps.

$\endgroup$
1
  • 1
    $\begingroup$ +1 For simple cases it is a good solution I forgot to mention but I came here because it was not enough for large datasets. Recalculating whole plot takes to much time then. $\endgroup$ Commented Aug 19, 2016 at 5:26

Start asking to get answers

Find the answer to your question by asking.

Ask question

Explore related questions

See similar questions with these tags.