8
$\begingroup$

Let's say I am plotting

Plot[{Sin[x], Cos[x]}, {x, 0, 2 π}, PlotStyle -> {Thickness[0.01], Thickness[0.01]}] 

I want to keep the same colors for the two functions — $\sin(x)$ and $\cos(x)$ — but want to increase the thickness of the minimum of two functions for each value of $x$. What is the easiest way to do that?

Edit

I want to clarify what I meant. Let's say the colors of the two functions f1 and f2 are blue and red and thickness for both functions is 0.01. Now for each x, I just want to increase the thickness of the function $min(f1, f2)$ in the same plot while keeping the blue and red colors separately for f1 and f2.

$\endgroup$
7
  • $\begingroup$ Do you mean you want varying thickness along the curve, depending on which curve is on top? $\endgroup$ Commented Jul 26, 2017 at 12:43
  • $\begingroup$ Thies, yes, exactly. $\endgroup$ Commented Jul 26, 2017 at 12:50
  • $\begingroup$ You could either achieve this by calling Plot[{Min[f1[x],f2[x]],Max[f1[x],f2[x]]}] and giving it different PlotStyles or by cutting the curves in segments where they cross and giving them individual PlotStyles. $\endgroup$ Commented Jul 26, 2017 at 12:51
  • 1
    $\begingroup$ possible duplicate: Plot the minimum of a list of functions $\endgroup$ Commented Jul 26, 2017 at 13:47
  • 1
    $\begingroup$ @Mr.Wizard, this answer in the linked q/a works for this case too. $\endgroup$ Commented Jul 26, 2017 at 14:07

5 Answers 5

7
$\begingroup$

Perhaps this is what you are looking for.

minSin[x_] /; Sin[x] < Cos[x] := Sin[x] minCos[x_] /; Sin[x] > Cos[x] := Cos[x] maxSin[x_] /; Sin[x] > Cos[x] := Sin[x] maxCos[x_] /; Sin[x] < Cos[x] := Cos[x] Plot[{minSin[x], maxSin[x], minCos[x], maxCos[x]}, {x, 0, 2 π}, PlotStyle -> {{Blue, Thickness[0.02]}, {Blue, Thickness[0.01]}, {Red, Thickness[0.02]}, {Red, Thickness[0.01]}}] 

plot

$\endgroup$
9
$\begingroup$

Choose two colors:

{c1,c2}={ColorData[97, 1], ColorData[97, 2]} 

Define a custom color function:

myColorFunction[x_] := If[Cos[x] > Sin[x], c1,c2] 

Generate two plots (because you can't specify two different color functions in the same plot) and combine them:

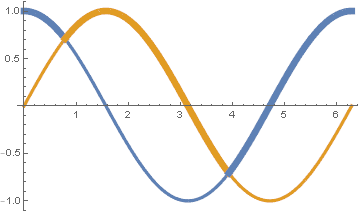
g1 = Plot[{Sin[x], Cos[x]}, {x, 0, 2 Pi}, PlotStyle -> {c1,c2}]; g2 = Plot[Min[Sin[x], Cos[x]], {x, 0, 2 Pi}, PlotStyle -> Thickness[0.015], ColorFunctionScaling -> False, ColorFunction -> (myColorFunction[#1] &), Exclusions -> None]; Show[g2, g1, PlotRange -> {-1,1}] 

Voilà:

enter image description here

$\endgroup$
8
$\begingroup$

One way of doing this which works in this case would be:

Plot[Evaluate[MinMax[{#1, #2}]], {x, 0, 2 \[Pi]}, PlotStyle -> {Thickness[0.01], Thickness[0.02]}, ColorFunctionScaling -> False, ColorFunction -> (ColorData[97][1 + Boole[Sin[#1] == #2]] &) ] &[Sin[x], Cos[x]] 

Plot with two curves with varying thickness

$\endgroup$
3
  • 3
    $\begingroup$ I think this doesn't answer the OP's question - the intention was to keep the colors but vary the thickness. $\endgroup$ Commented Jul 26, 2017 at 13:31
  • 1
    $\begingroup$ Fixed my answer. $\endgroup$ Commented Jul 26, 2017 at 15:23
  • 1
    $\begingroup$ That's very nice. $\endgroup$ Commented Jul 26, 2017 at 15:35
7
$\begingroup$

Modifying this answer slightly:

flist = {Sin[x], Cos[x]}; pieces = Table[ConditionalExpression[f, f == Min[flist]], {f, flist}]; pltstyls = Join[#, Directive[{#, Thickness[.007]}] & /@ #] &[ ColorData[97, "ColorList"][[;; Length@flist]]]; Plot[Evaluate@Join[flist, pieces], {x, 0, 10}, PlotStyle -> pltstyls] 

enter image description here

More generally, for arbitrary number of functions and filling:

flist = {Sin[x], Cos[x], x Sin[x]/2}; filling = Thread[Range[Length@flist] -> Axis]; pieces = Table[ConditionalExpression[f, f == Min[flist]], {f, flist}]; pltstyls = Join[#, Directive[{#, Thickness[.007]}] & /@ #] &[ ColorData[97, "ColorList"][[;; Length@flist]]]; Plot[Evaluate@Join[flist, pieces], {x, 0, 10}, Filling -> filling, PlotStyle -> pltstyls] 

enter image description here

$\endgroup$
2
  • $\begingroup$ I think the filling and the third line obfuscate this somewhat, but +1 nevertheless. $\endgroup$ Commented Jul 26, 2017 at 14:17
  • $\begingroup$ Thank you @Mr.Wizard. $\endgroup$ Commented Jul 26, 2017 at 14:24
2
$\begingroup$

Applying a modification of my own method from Plot the minimum of a list of functions, and perhaps proving kglr's assertion that this question is a duplicate:

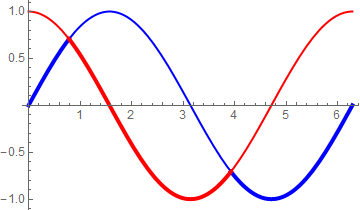
emph[fn_][a__] := Riffle[{a}, If[# == fn[a], #] & /@ {a}] Plot[emph[Min][Sin[x], Cos[x]], {x, 0, 2 Pi} , Evaluated -> True , PlotStyle -> Tuples[{{Blue, Red}, AbsoluteThickness /@ {2, 4}}] ] 

enter image description here

$\endgroup$

Start asking to get answers

Find the answer to your question by asking.

Ask question

Explore related questions

See similar questions with these tags.