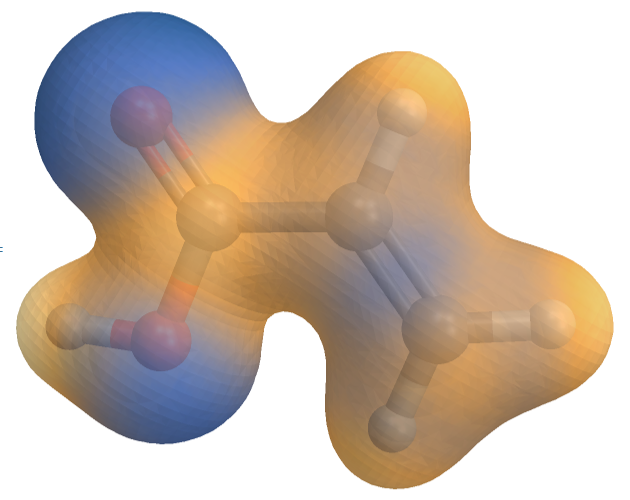
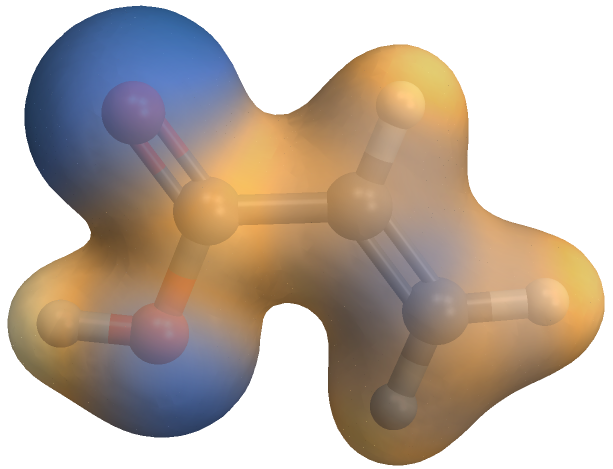
After performing Gaussian calculation, cube files can be obtained. The distributions are the potential cube and esp cube, both of which contain volume data. What I want to do now is to project the potential cube onto the esp cube file, which is the "molecular isosurface electrostatic potential map".
"molecular isosurface electrostatic potential map" like this:
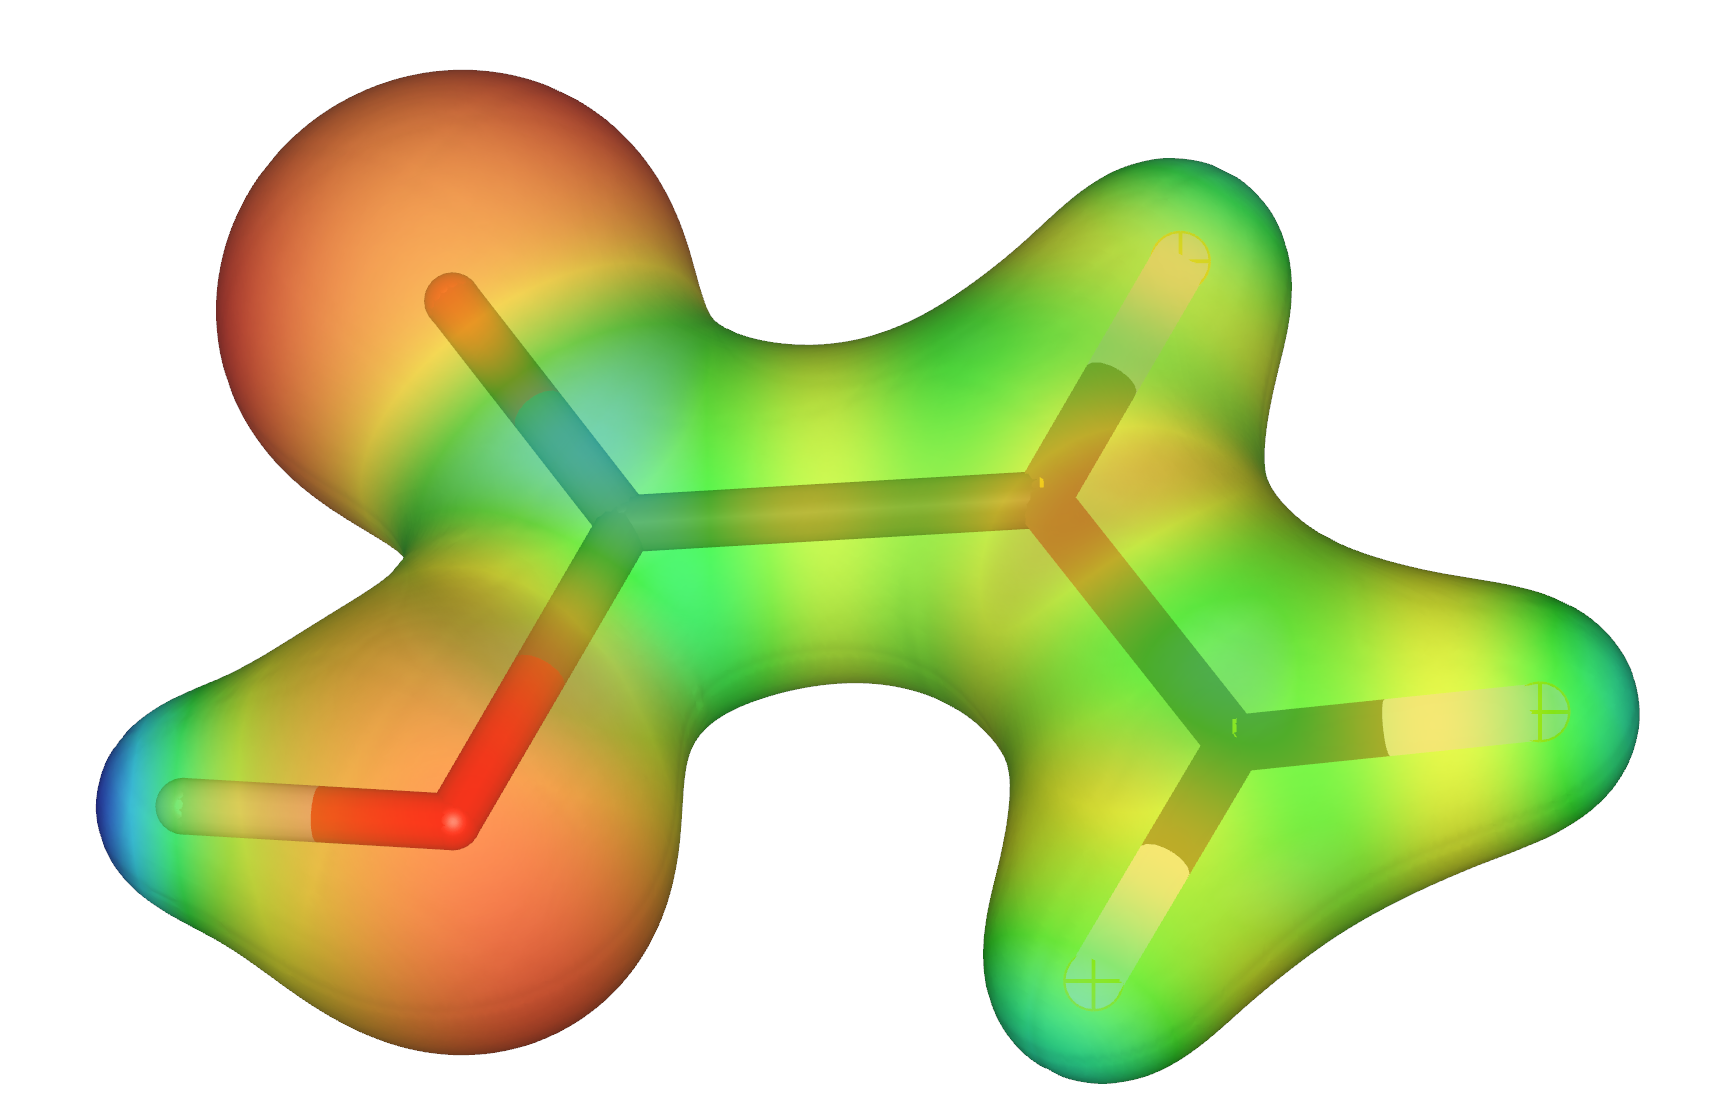
This image was created using the VESTA crystallography software. Although it is quite good, it cannot meet some of my specific requirements.
Below is a part of the code I am working on, with comments.
(* === 1. Define file path === *) path1 = "http://pic.wxyh.top/C3H4O2-esp.cube"; path2 = "http://pic.wxyh.top/C3H4O2-Potential.cube"; (* === 2. Import volumetric data === *) espCube = Import[path1, "VolumetricData"]; (* Import esp.cube file *) potentialCube = Import[path2, "VolumetricData"]; (* Import Potential.cube file *) (* === 3. Get data information === *) espData = espCube["Data"]; (* Extract data from esp.cube file *) potentialData = potentialCube["Data"]; (* Extract data from Potential.cube file *) dataRange = espCube["DataRange"]; (* Get data range *) (* === 4. Process data === *) espDataNormal = Normal[espData]; (* Normalize espData *) potentialDataNormal = Normal[potentialData]; (* Normalize potentialData *) (* One of the processing steps for isosurface electrostatic potential maps that calculates the electrostatic interaction energy for each ion *) projectedData = MapThread[Times, {espDataNormal, potentialDataNormal}, 3] projectedDataNormal = Normal[projectedData] 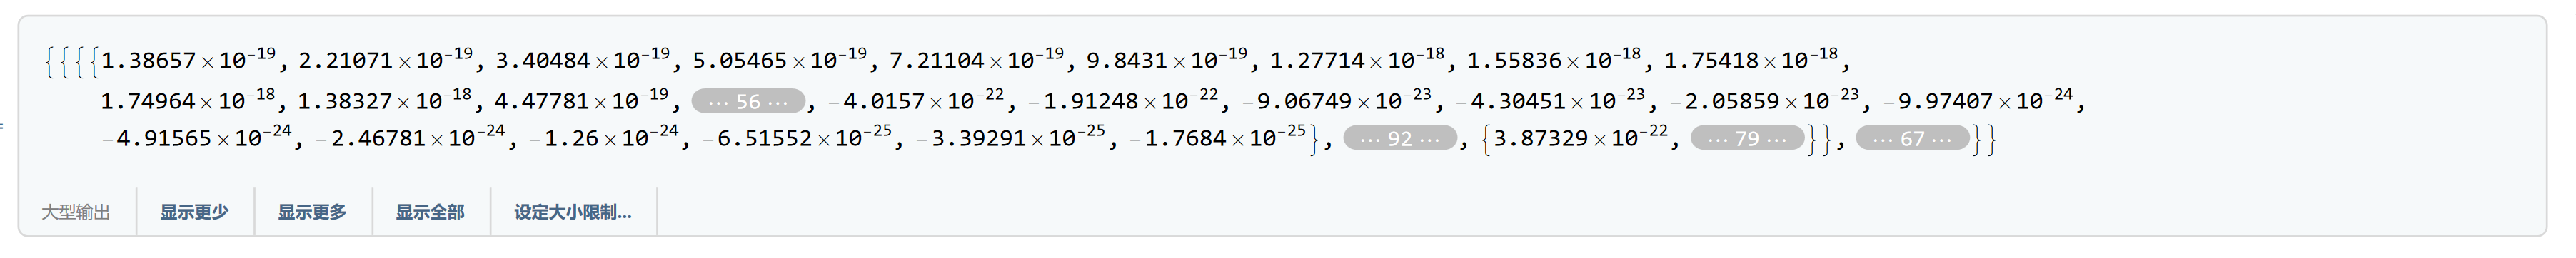
The data obtained in the end is of this type. I know that ListContourPlot3D can be used to plot the graph later, but I don't know how to process this data. I'm not sure how to convert it into a three-dimensional coordinate format. The data is too long and I'm feeling a bit overwhelmed.