I am trying to plot the following linear system ($3\times 3$) in different ways. My question is what wrong have I done to my last code?
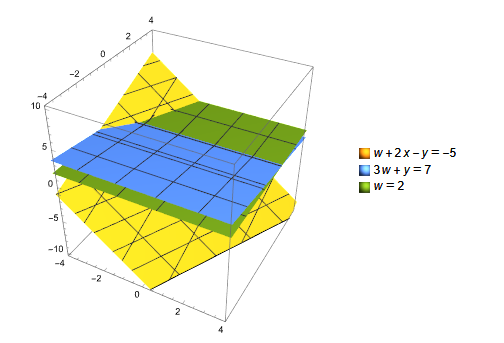
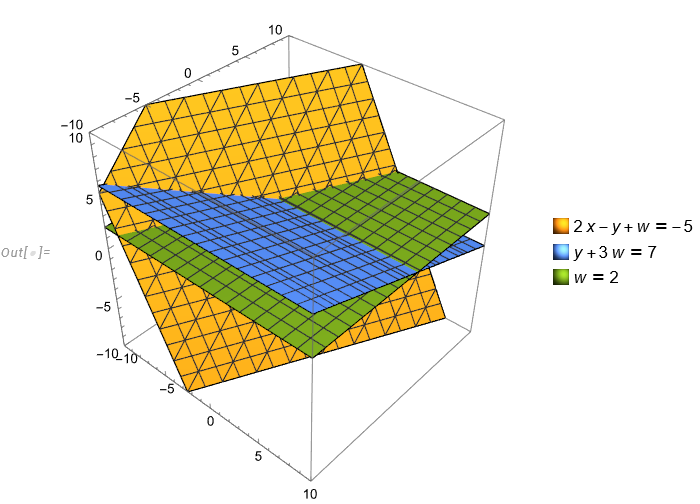
eq1 = 2 x - y + w == -5; eq2 = y + 3*w == 7; eq3 = w == 2; (*Use ContourPlot3D to visualize*) ContourPlot3D[{2 x - y + w == -5, y + 3*w == 7, w == 2}, {x, -10, 10}, {y, -10, 10}, {w, -10, 10}, PlotLegends -> "Expressions"] 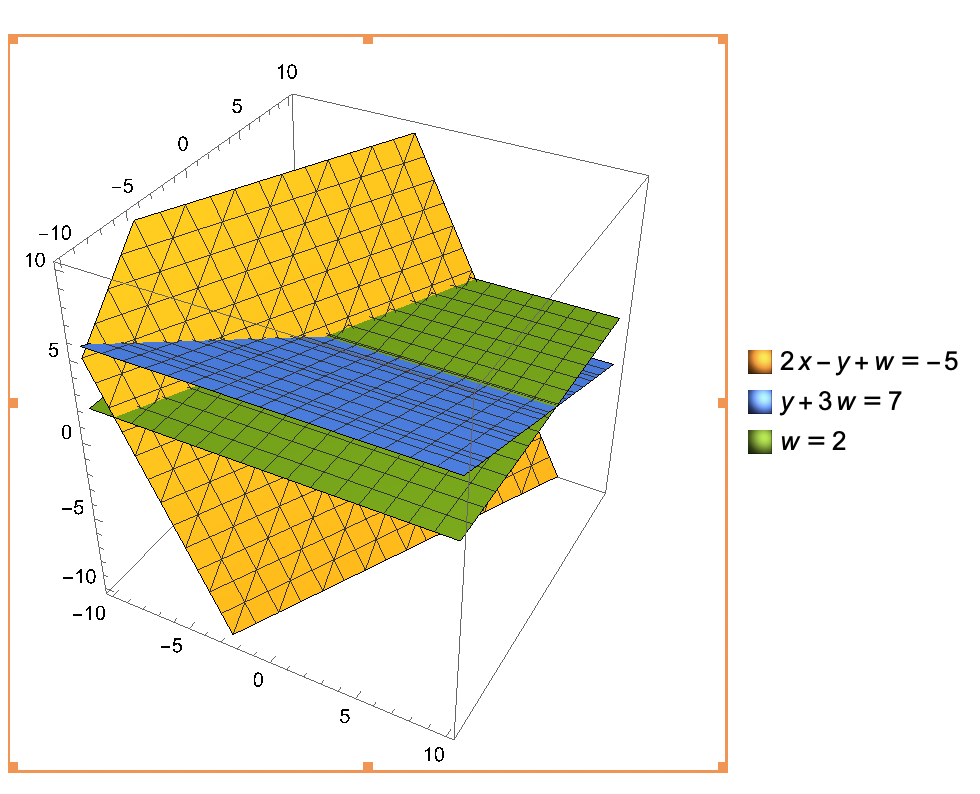
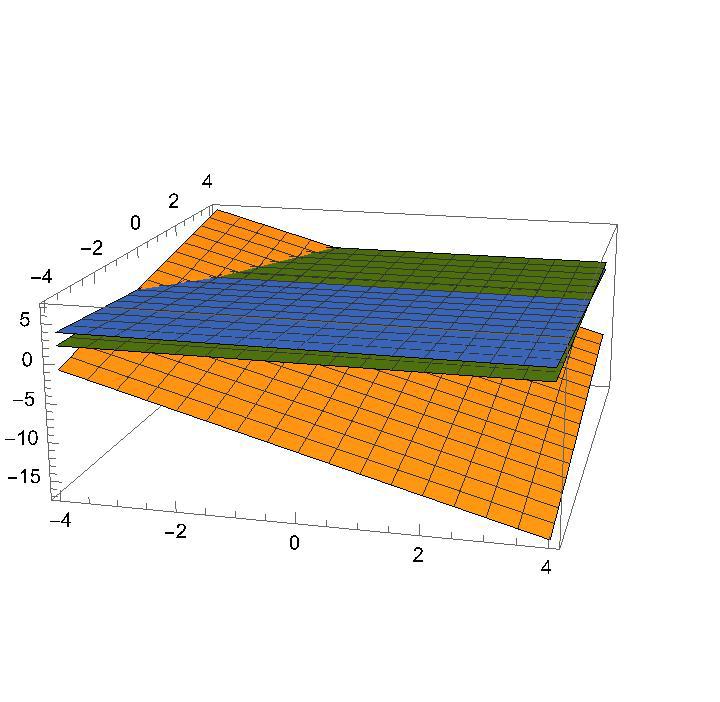
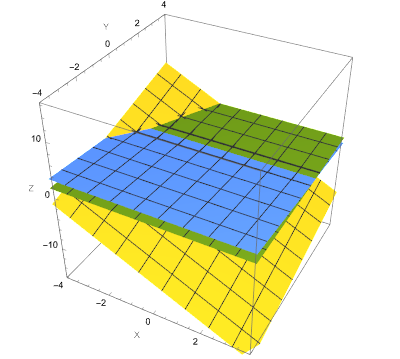
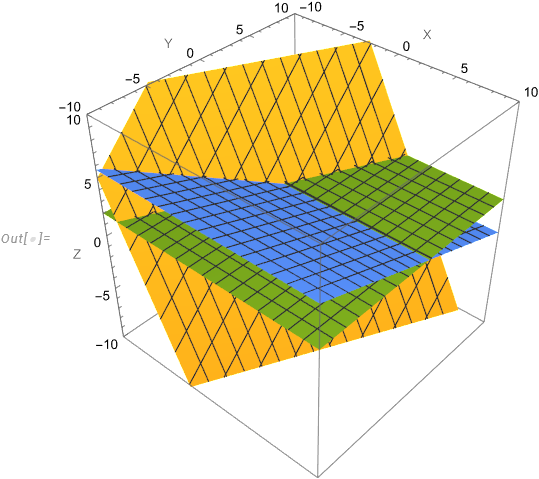
ParametricPlot3D[{{x, y, -5 - 2 x + y}, {x, y, (7 - y)/3}, {x, y, 2}}, {x, -10, 10}, {y, -10, 10}, AxesLabel -> {"X", "Y", "Z"}, BoxRatios -> {1, 1, 1}] 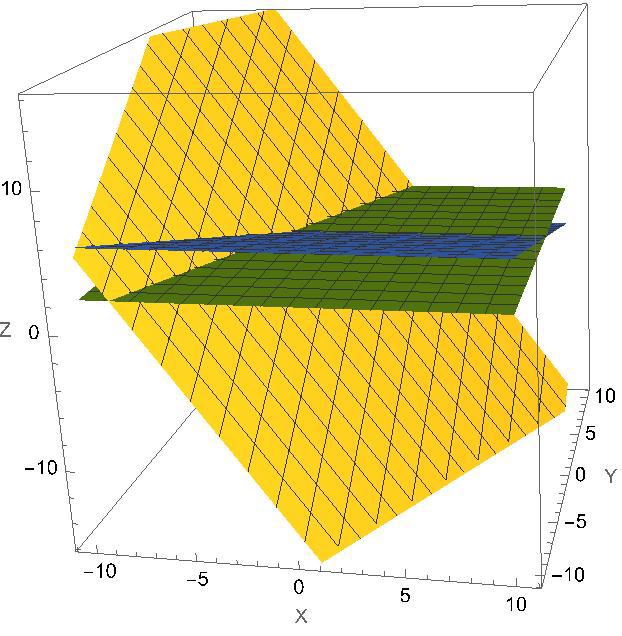
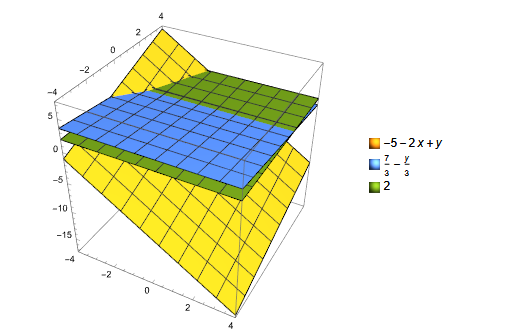
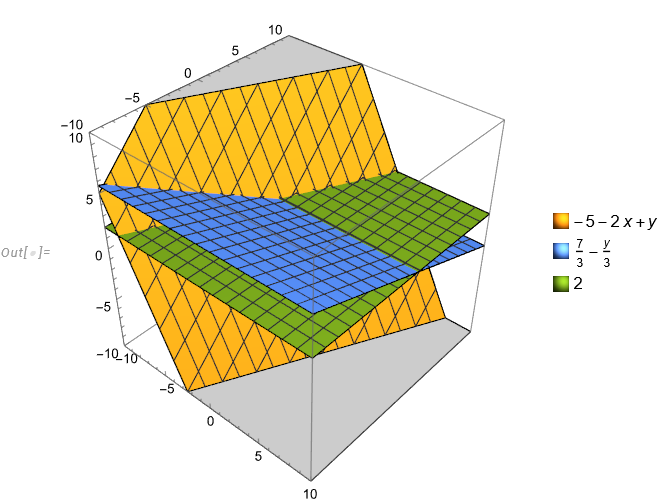
Plot3D[{-5 - 2 x + y, (7/3) - (1/3) y, 2}, {x, -4, 4}, {y, -4, 4}, PlotLegends -> " Expressions"]