How can I get the co-ordinates of the convex hull of a piece of Text?
$\begingroup$ $\endgroup$
1 - 2$\begingroup$ Anyone would have a method that doesn’t first rasterize the text? $\endgroup$F'x– F'x2012-04-01 18:13:06 +00:00Commented Apr 1, 2012 at 18:13
Add a comment |
4 Answers
$\begingroup$ $\endgroup$
An alternative approach that does not require the ComputationalGeometry package: You can use a combination of ClusteringComponents and ComponentMeasurements as follows:
Define
chVertices[txtimg_] := Insert[#, First@#, -1] &@ ComponentMeasurements[ClusteringComponents[Binarize@txtimg, 2], "ConvexVertices"][[2, 2]] Example data:
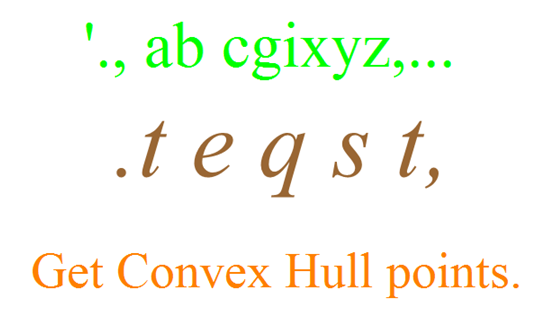
textimg1 = Image[Graphics[ Text[Style["'., ab cgixyz,...", Green, FontFamily -> "Times", FontSize -> 72]]], ImageSize -> {600, 100}]; textimg2 = Image[Graphics[{EdgeForm[], Brown, ImportString[ExportString[ Style[".t e q s t,", Italic, FontFamily -> "Times", FontSize -> 36], "PDF"], "PDF", "TextMode" -> "Outlines"][[1, 1]]}], ImageSize -> {600, 100}]; textimg3 = Image[Graphics[ Text[Style["Get Convex Hull points.", Orange, 56]]], ImageSize -> {600, 100}]; Input pictures:
Results:
Row[Show[#, Graphics@{Red, Thick, Line[chVertices[#]]}] & /@ {textimg1, textimg2, textimg3}] 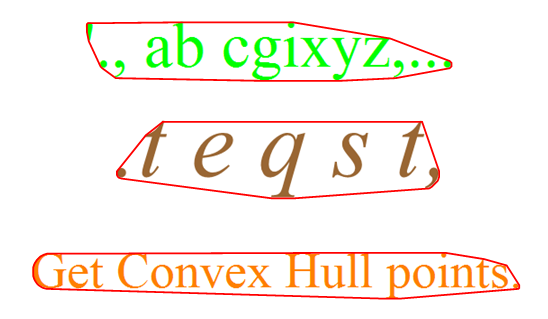
$\begingroup$ $\endgroup$
The question could be rephrased: how do we get a vector graphic from a bitmap? The solution is pretty simple by using the code we can find here.
p = Image[Graphics[Text[Style["Get Convex Hull points.", Large]]]]; img = Thinning@EdgeDetect@p; points = N@Position[ImageData[img], 1]; pts = Union@Flatten[FindCurvePath[points] /. c_Integer :> points[[c]], 1]; Needs["ComputationalGeometry`"] chp = ConvexHull[pts]; Show[ Graphics@{Red, Thick, Line[Append[pts[[chp]], pts[[chp]][[1]]]]}, ListPlot[pts]] 
$\begingroup$ $\endgroup$
Another method:
text = Rasterize["Text"]; data = Position[text[[1, 1]], {0, 0, 0}]; rotated = RotationMatrix[90 Degree].# & /@ data; data2D = {-#1, #2} & @@@ rotated; << ComputationalGeometry` Quiet[convexhull = ConvexHull[data2D]]; hull = PlanarGraphPlot[data2D, convexhull]; Graphics[{Black, Point[data2D], hull[[1, 2]]}] 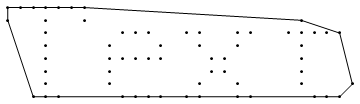
Working it a bit more:
t = Text[Style["Text", FontFamily -> "Times", FontSize -> 48]]; text = Rasterize[t, ImageResolution -> 80]; data = Position[text[[1, 1]], Table[Except@255, {3}]]; rotated = RotationMatrix[90 Degree].# & /@ data; data2D = {-#1, #2} & @@@ rotated; << ComputationalGeometry` Quiet[convexhull = ConvexHull[data2D]]; hull = PlanarGraphPlot[data2D, convexhull]; Graphics[{Black, Point[data2D], hull[[1, 2]]}] 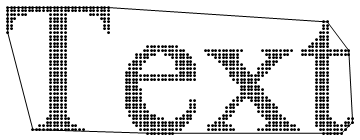
{{xmin, xmax}, {ymin, ymax}} = {Min@#, Max@#} & /@ Transpose[data2D]; Graphics[{Black, Inset[text, {xmin + (xmax - xmin)/2 - 1, ymin + (ymax - ymin)/2}, Center, Reverse@Most[Dimensions[text[[1, 1]]]]], Red, hull[[1, 2]]}, PlotRange -> {{xmin - 3, xmax + 3}, {ymin - 3, ymax + 3}}] 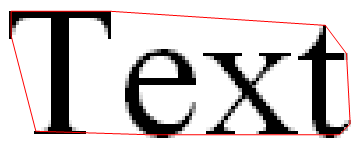
$\begingroup$ $\endgroup$
In Version 10, this can be elegantly done in one line. First we create some text (stealing from @kguler) as follows:
img = Image[Graphics[Text[Style["'., ab cgixyz,...", Green, FontFamily -> "Times", FontSize -> 72]]], ImageSize -> {600, 100}]; Then:
cvx = ConvexHullMesh @ ImageValuePositions[EdgeDetect[img, 3], White]; Visualize:
Show[img, Graphics[GraphicsComplex[MeshCoordinates[cvx], {Thick, Red, MeshCells[cvx, 1]}]]]