Here is one method, now more robust:
pwSplit[_[pairs : {{_, _} ..}]] := Piecewise[{#}, Indeterminate] & /@ pairs pwSplit[_[pairs : {{_, _} ..}, expr_]] := Append[pwSplit@{pairs}, pwSplit@{{{expr, Nor @@ pairs[[All, 2]]}}}] Testing:
pw = Piecewise[{{x^2, x < 0}, {x, 2 > x > 0}, {Log[x], x > 2}}]; Plot[Evaluate[pwSplit@pw], {x, -2, 4}, PlotStyle -> Thick, Axes -> False] 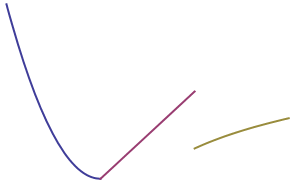
pw = Integrate[Piecewise[{{E^x, x^2 <= 1}}, Sin[x]], x]; Plot[Evaluate[pwSplit @ pw], {x, -2, 2}, PlotStyle -> Thick, PlotRange -> Full] 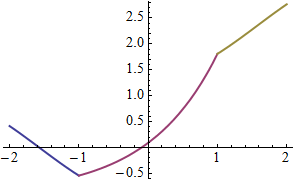
I like Heike's method so much I have to do my own version of it.
Module[{i = 1}, Plot[pw, {x, -2, 2}, PlotStyle -> Thick] /. Linex_Line -:> ({ColorData[1][i++], Line[##]x} &) ]

