Post Closed as "Needs details or clarity" by m_goldberg, Dunlop, Alex Trounev, MarcoB, AsukaMinato
Rollback to Revision 1
Source Link
halirutan
  • 113.9k
  • 7
  • 269
  • 488

how di i get this graph pls ty How do I label the x-axis bars in my bar chart?

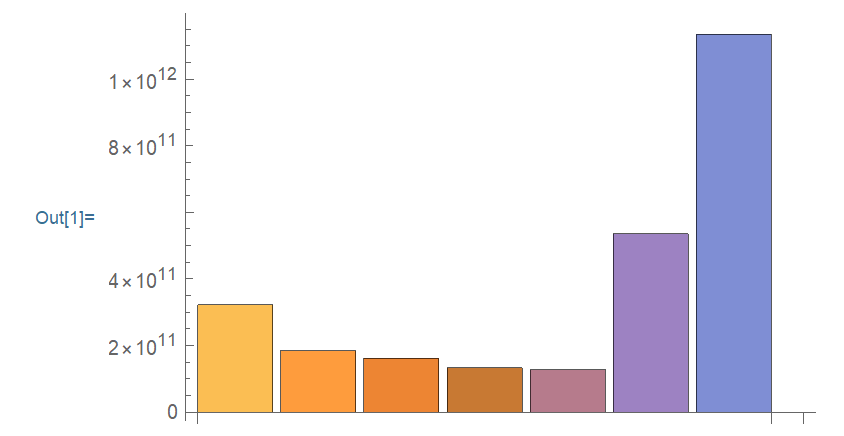
input: BarChart[{{322065200000, 184408300000, 161032600000, 132462300000, 127267700000, 535043800000, 1135020100000}, ChartLabels -> {"Latin America and Caribbean (LAC)", "Europe and Central Asia (ECA)", "Middle East and North Africa (MENA)", "South Asia (SAR)", "Africa (AFR)", "East Asia and Pacific (EAP)", "Organization for Economic Cooperation and Development (OECD)"}}]

output: enter image description here

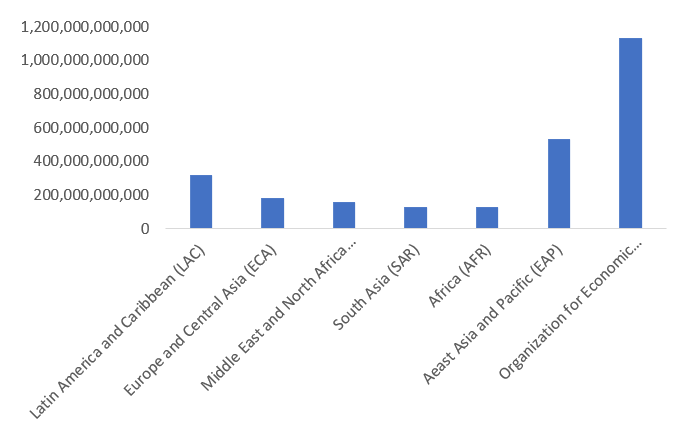
I want the names of the countries labelled below the bars. I also don't want the numbers on the y-axis to show scientific notation.

Ideally I'd want my graph to look like this: [![enter image description here][2]][2]enter image description here
how di i get this graph pls ty

I want the names of the countries labelled below the bars. I also don't want the numbers on the y-axis to show scientific notation.

Ideally I'd want my graph to look like this: [![enter image description here][2]][2]

How do I label the x-axis bars in my bar chart?

input: BarChart[{{322065200000, 184408300000, 161032600000, 132462300000, 127267700000, 535043800000, 1135020100000}, ChartLabels -> {"Latin America and Caribbean (LAC)", "Europe and Central Asia (ECA)", "Middle East and North Africa (MENA)", "South Asia (SAR)", "Africa (AFR)", "East Asia and Pacific (EAP)", "Organization for Economic Cooperation and Development (OECD)"}}]

output: enter image description here

I want the names of the countries labelled below the bars. I also don't want the numbers on the y-axis to show scientific notation.

Ideally I'd want my graph to look like this: enter image description here

deleted 88 characters in body; edited tags; edited title
Source Link

How do I label the x-axis bars in my bar chart? how di i get this graph pls ty

input: BarChart[{{322065200000, 184408300000, 161032600000, 132462300000, 127267700000, 535043800000, 1135020100000}, ChartLabels -> {"Latin America and Caribbean (LAC)", "Europe and Central Asia (ECA)", "Middle East and North Africa (MENA)", "South Asia (SAR)", "Africa (AFR)", "East Asia and Pacific (EAP)", "Organization for Economic Cooperation and Development (OECD)"}}]

output: enter image description here

I want the names of the countries labelled below the bars. I also don't want the numbers on the y-axis to show scientific notation.

Ideally I'd want my graph to look like this: enter image description here[![enter image description here][2]][2]

How do I label the x-axis bars in my bar chart?

input: BarChart[{{322065200000, 184408300000, 161032600000, 132462300000, 127267700000, 535043800000, 1135020100000}, ChartLabels -> {"Latin America and Caribbean (LAC)", "Europe and Central Asia (ECA)", "Middle East and North Africa (MENA)", "South Asia (SAR)", "Africa (AFR)", "East Asia and Pacific (EAP)", "Organization for Economic Cooperation and Development (OECD)"}}]

output: enter image description here

I want the names of the countries labelled below the bars. I also don't want the numbers on the y-axis to show scientific notation.

Ideally I'd want my graph to look like this: enter image description here

how di i get this graph pls ty

I want the names of the countries labelled below the bars. I also don't want the numbers on the y-axis to show scientific notation.

Ideally I'd want my graph to look like this: [![enter image description here][2]][2]
Source Link

How do I label the x-axis bars in my bar chart?

input: BarChart[{{322065200000, 184408300000, 161032600000, 132462300000, 127267700000, 535043800000, 1135020100000}, ChartLabels -> {"Latin America and Caribbean (LAC)", "Europe and Central Asia (ECA)", "Middle East and North Africa (MENA)", "South Asia (SAR)", "Africa (AFR)", "East Asia and Pacific (EAP)", "Organization for Economic Cooperation and Development (OECD)"}}]

output: enter image description here

I want the names of the countries labelled below the bars. I also don't want the numbers on the y-axis to show scientific notation.

Ideally I'd want my graph to look like this: enter image description here