-1
$\begingroup$

input: BarChart[{{322065200000, 184408300000, 161032600000, 132462300000, 127267700000, 535043800000, 1135020100000}, ChartLabels -> {"Latin America and Caribbean (LAC)", "Europe and Central Asia (ECA)", "Middle East and North Africa (MENA)", "South Asia (SAR)", "Africa (AFR)", "East Asia and Pacific (EAP)", "Organization for Economic Cooperation and Development (OECD)"}}]

output: enter image description here

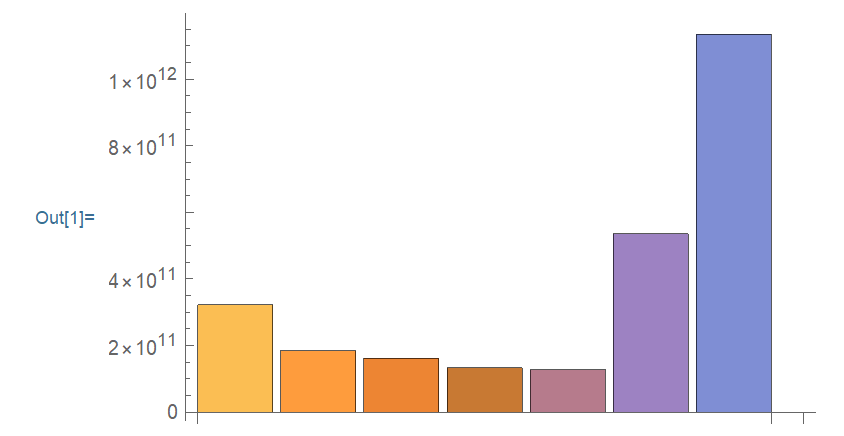
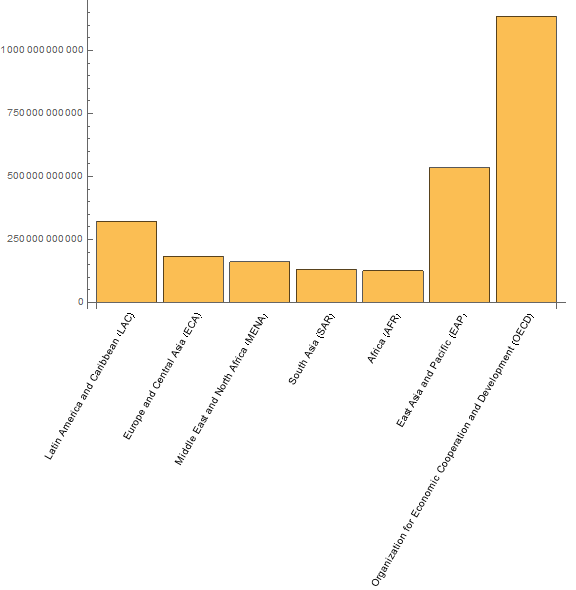
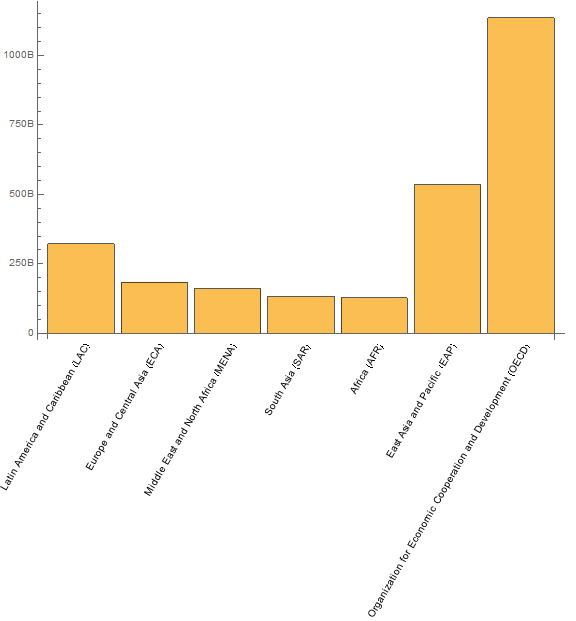
I want the names of the countries labelled below the bars. I also don't want the numbers on the y-axis to show scientific notation.

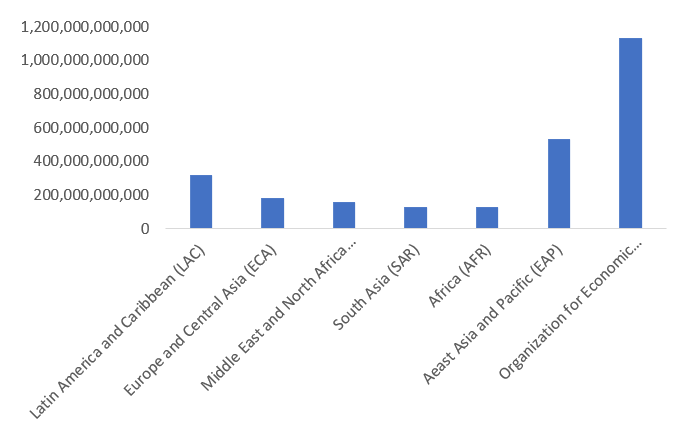
Ideally I'd want my graph to look like this: enter image description here

$\endgroup$

1 Answer 1

2
$\begingroup$
labels = Style[#, 16] & /@ StringPadRight[#, StringLength@# + 3] & /@ {"Latin America and Caribbean (LAC)", "Europe and Central Asia (ECA)", "Middle East and North Africa (MENA)", "South Asia (SAR)", "Africa (AFR)", "East Asia and Pacific (EAP)", "Organization for Economic Cooperation and Development (OECD)"}; BarChart[{322065200000, 184408300000, 161032600000, 132462300000, 127267700000, 535043800000, 1135020100000}, ChartLabels -> Placed[labels, {{3/4, 0}, {1, 1}}, Rotate[#, Pi/3] &], ImageSize -> Large, Ticks -> {Automatic, Charting`ScaledTicks["Linear"][#, #2, {6, 6}] /. {x_Real, _Row, z___} :> {x, IntegerPart[x], z} &}] 

enter image description here

Use ChartLabels -> Placed[labels, None] and add the option

LabelingFunction -> (Placed[#3[[2, 1]], {{3/4, 0}, {1, 1}}, Rotate[#, Pi/3] &]&) 

to get the same picture.

Use Row[{IntegerPart[x]/10^9, "B"}] instead of IntegerPart[x] to get:

enter image description here

$\endgroup$
1

Start asking to get answers

Find the answer to your question by asking.

Ask question

Explore related questions

See similar questions with these tags.