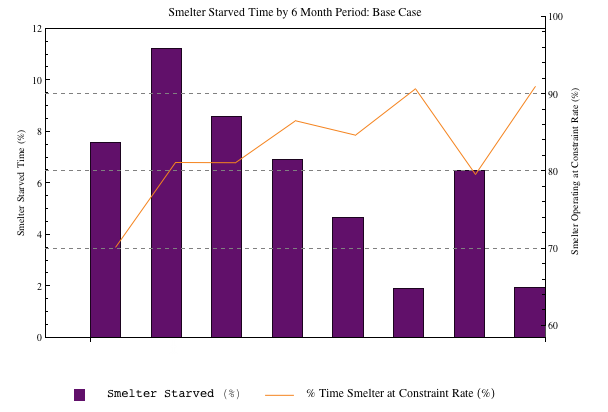
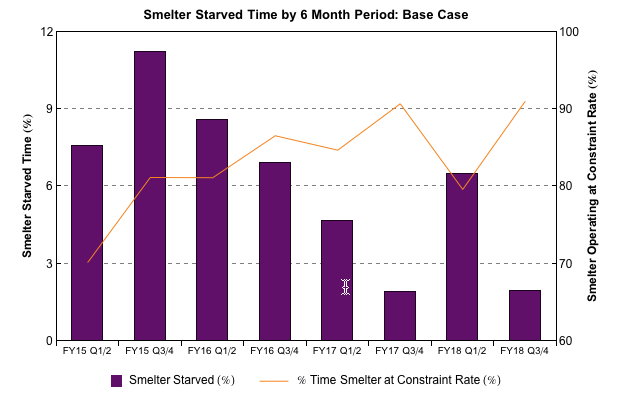
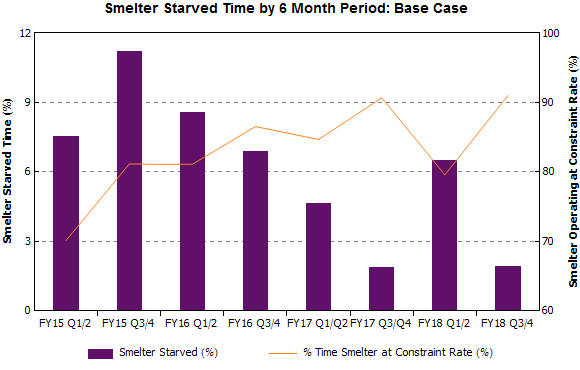
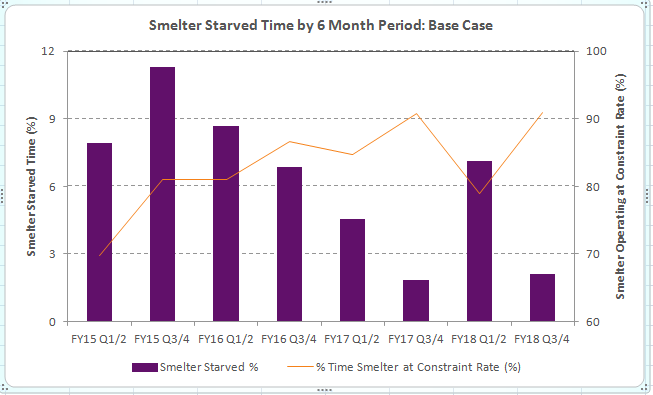
I've been asked to reproduce a bar chart generated in Excel in Mathematica. The original Excel chart looks like this;
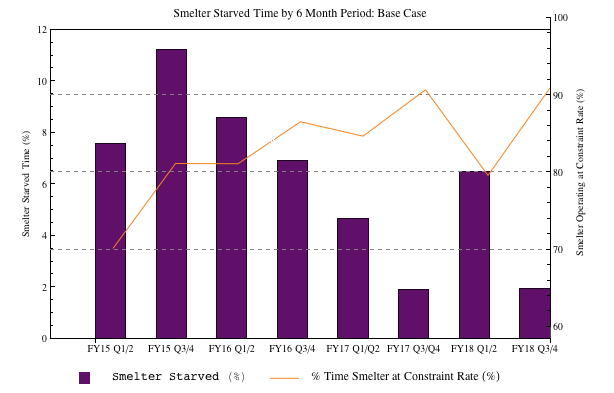
My Mathematica version looks like this;
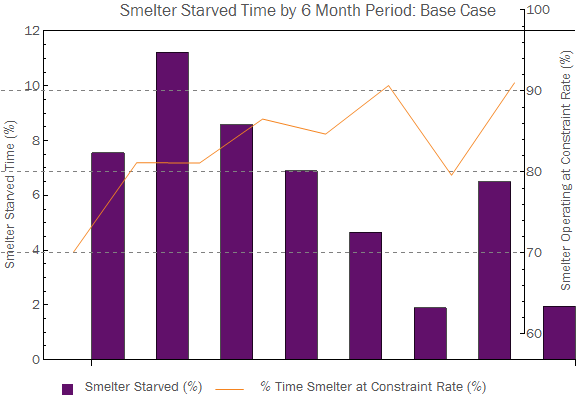
There are a couple of things wrong that I'd like to fix;
- The
BarChartandListPlotoverlay doesn't seem to match up. - The
ChartLabelsseem to have disappeared on theBarChart. - Is there a nice way to make the ticks on the left and right sides match up (like when the Excel chart matches 9 % on the left to 90 % on the right)?
- I can't get the box and line to center align to the text in the legend.
Questions 1 and 2 are what I really need to fix, but 3 and 4 would be nice to have. Any help would be appreciated.
Here's the code I used to generate my chart;
purple = RGBColor[97/255, 16/255, 106/255]; orange = RGBColor[245/255, 132/255, 31/255]; labels = { "FY15 Q1/2", "FY15 Q3/4", "FY16 Q1/2", "FY16 Q3/4", "FY17 Q1/Q2", "FY17 Q3/Q4", "FY18 Q1/2", "FY18 Q3/4" }; starvedTime = {7.55, 11.23, 8.58333, 6.88833, 4.65167, 1.89, 6.49833, 1.95}; satTime = {70.1483, 81.1467, 81.115, 86.5483, 84.6833, 90.685, 79.6017, 91.0133}; plot1 = BarChart[starvedTime, PlotRange -> {0, 12}, ChartStyle -> purple, BaseStyle -> "Text", Frame -> {True, True, True, False}, FrameTicks -> {False, True}, FrameLabel -> {None, Style["Smelter Starved Time (%)", "Text"], None, None}, PlotLabel -> "Smelter Starved Time by 6 Month Period: Base Case", ImageSize -> Large, ChartLabels -> {Placed[Style[#, "Text"] & /@ labels, Below], None}, AxesOrigin -> {0, 0}, PlotRangePadding -> {0, 0}, BarSpacing -> 1]; plot2 = ListPlot[satTime, Joined -> True, PlotRange -> {60, 100}, PlotStyle -> orange, Frame -> {False, False, False, True}, FrameTicks -> {None, None, None, All}, FrameLabel -> {None, None, None, Style["Smelter Operating at Constraint Rate (%)", "Text"]}, BaseStyle -> "Text", GridLines -> {None, Automatic}, GridLinesStyle -> Directive[Gray, Dashed], ImageSize -> Large]; box = Graphics[{purple, Rectangle[]}, ImageSize -> 12]; text = Style[" Smelter Starved (%) ", "Text"]; line = Graphics[{orange, Line[{{0, 0.5}, {1, 0.5}}]}, ImageSize -> {30, Automatic}]; text2 = Text[Style[" % Time Smelter at Constraint Rate (%) ", "Text"]]; legend = Row[{box, text, line, text2}]; Column[{Overlay[{plot1, plot2}], legend}, Alignment -> {Center, Center}]