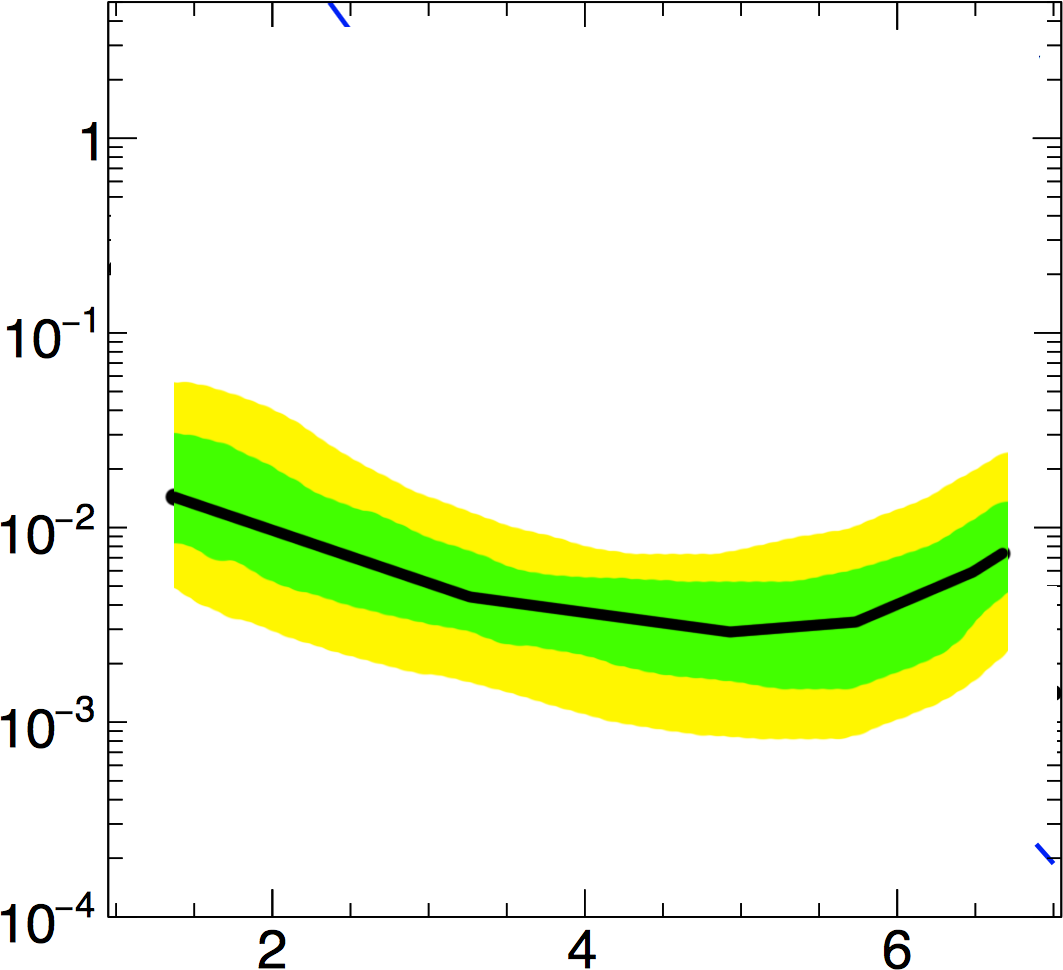
I need to extract the bounds of the yellow and green regions in the picture at the end of the post. I need only to reproduce these regions on mathematica. I tried with the algorithm described here Recovering data points from an image but I get a strange result.
First, I extract some points to define the transformation which map the points of the image to the point of the plot
{x2, x1, y1, y2} = {{585.0590211326179`, 54.42786889217291`}, {272.0827458675517`, 54.633881634729505`}, {108.28544780639066`, 442.48720495490045`}, {108.04509960674113`, 637.3237562279448`}}; and then
trans = FindGeometricTransform[{{10^-4, 4}, {10^-4, 2}, {1.5, 10^-2}, {1.5, 10^-3}}, {x2, x1, y1, y2}][[2]]; I check if the transformation works well
In[8]:= trans@{x2, x1, y1, y2} Out[8]= {{0.0001, 4.}, {0.0001, 2.}, {1.5, 0.01}, {1.5, 0.001}} and then
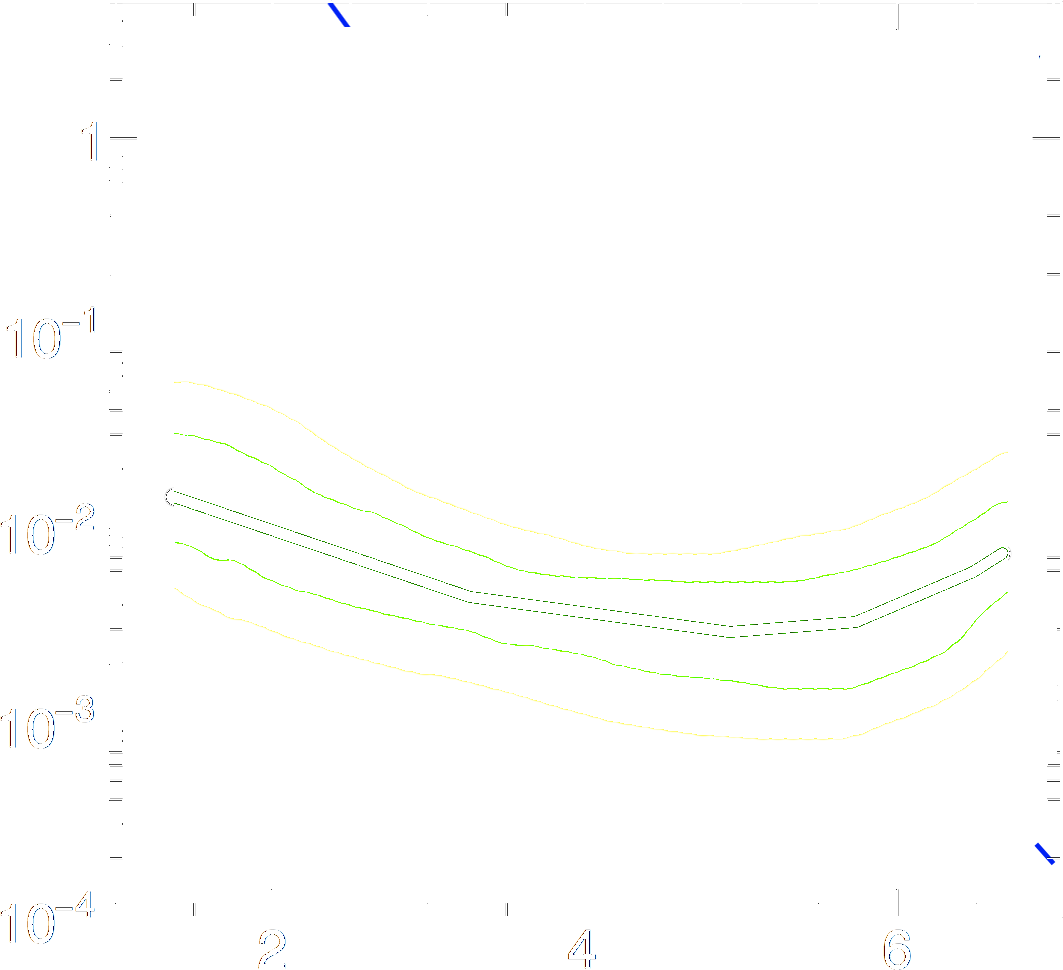
data = Round[ImageData[img], 1]; col = DeleteDuplicates[Flatten[Round[ImageData[img], 1], 1]]; Graphics[{RGBColor[#], Disk[]}, ImageSize -> Tiny] & /@ col  I want to extract the 6th color, then
binImage = Image@Replace[data, {col[[6]] -> 1, _ :> 0}, {2}]; curve = ImageApply[{0, 0, 0} &, binImage, Masking -> ColorNegate[Binarize[GaussianFilter[binImage, 5]]]]; curvLoc = (Reverse /@ Position[ImageData[curve, DataReversed -> True], {1., 1., 1.}]); Show[ListPlot[trans@curvLoc, PlotRange -> All]] Then the result is wrong
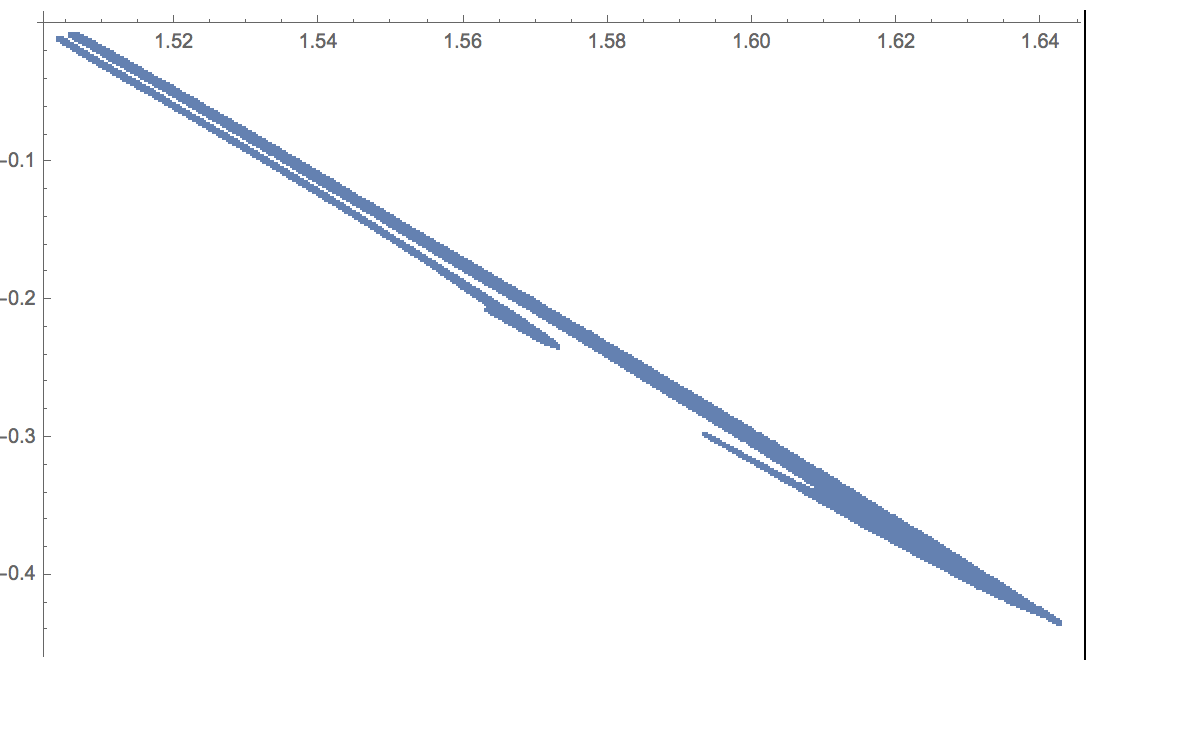
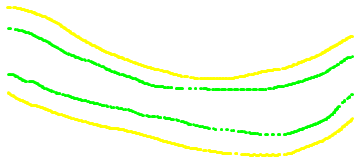
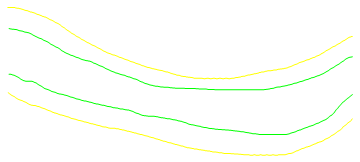
and moreover I need just to extract the frontier of these regions, I don't need the internal points
Any help?