5
$\begingroup$

This feels like it should be pretty simple but I am struggling. Does anyone know how to control the thickness of the lines of the bar in a histogram?

I tried playing with ChartStyle and BaseStyle but nothing seems to manipulate the line thickness of the bars.

Cheers!

EDIT:

Histogram[ {Table[n/n 0.0, {n, 1, 400}], Table[n/n 0.2, {n, 1, 137}], Table[n/n 0.4, {n, 1, 45}], Table[n/n 0.6, {n, 1, 13}], Table[n/n 0.8, {n, 1, 3}], Table[n/n 1.0, {n, 1, 1}], Table[n/n 1.2, {n, 1, 1}]}, ChartStyle -> White, Evaluate[PlotStyles], BaseStyle -> Thickness[0.0025], ImagePadding -> {{60, 60}, {50, 5}} ]; 
$\endgroup$
3
  • $\begingroup$ Can you includes some code to showcase your problem? $\endgroup$ Commented Feb 20, 2017 at 15:33
  • $\begingroup$ @MarcoB I have added my code. $\endgroup$ Commented Feb 20, 2017 at 15:40
  • $\begingroup$ @QuantumPenguin - in your code PlotStyles doesn't evaluate to anything. Regardless, the answers below should be able to help $\endgroup$ Commented Feb 20, 2017 at 15:45

3 Answers 3

6
$\begingroup$

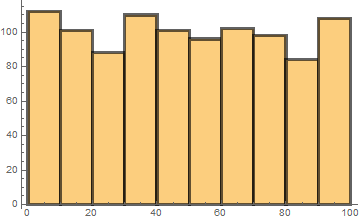
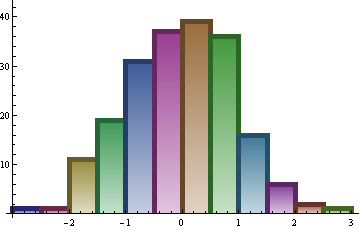
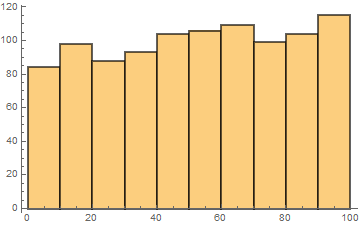
Update 2: Based on the accepted answer it now seems that removing the bottom of edge of rectangles is not essential. In that case, the option ChartBaseStyle gives the desired result (there is no need for custom ChartElementFunctions):

Histogram[data, ChartBaseStyle -> EdgeForm[Thickness[.01]]] 

enter image description here

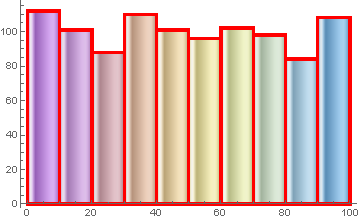
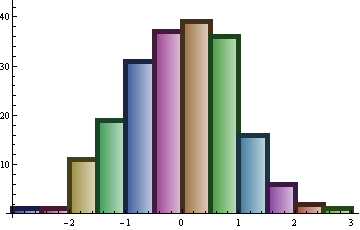
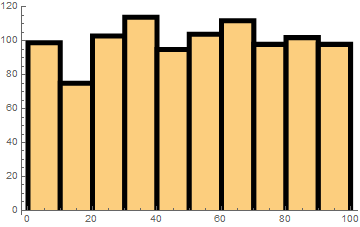
Histogram[data, ChartStyle -> "Pastel", ChartElementFunction -> "GlassRectangle", ChartBaseStyle -> EdgeForm[{Opacity[1, Red], Thickness[.01]}]] 

enter image description here

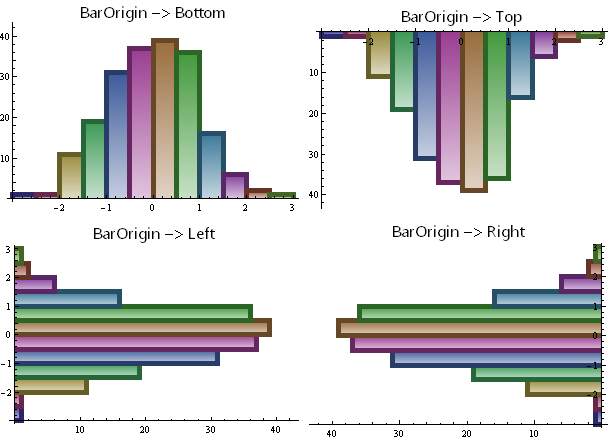
Update: The ChartElementFunction in the original post works only for the default setting for the option BarOrigin. The new function ceF2 works for arbitrary values for the BarOrigin option.

ceF2[cedf_: "GlassRectangle", o : OptionsPattern[]][col_: Black, thickness_: 3] := Module[{or = Charting`ChartStyleInformation["BarOrigin"], ll = Tuples[#][[{1, 2, 4, 3}]]}, ll = RotateRight[ll, Switch[or, Bottom, 0, Top, 2, Left, 3, Right, 1]] ; {ChartElementDataFunction[cedf, o][##], col, AbsoluteThickness[thickness], CapForm["Butt"], Line[ll]}] & 

Examples:

Grid[Partition[Histogram[data, ChartStyle -> 1, ImageSize -> 300, PlotLabel -> Style["BarOrigin -> " <> ToString[#], 16, "Panel"], ChartElementFunction -> ceF2["FadingRectangle", "GradientOrigin" -> Top][ Dynamic[Darker@CurrentValue["Color"]], 5], BarOrigin -> #] & /@ {Bottom, Top, Left, Right}, 2]] 

Mathematica graphics

Original post:

A more flexible chart element function that modifies built-in chart element functions to add thick lines:

ClearAll[ceF] ceF[cedf_: "GlassRectangle", o : OptionsPattern[]][col_: Black, thickness_: 3] := {ChartElementDataFunction[cedf, o][##], col, AbsoluteThickness[thickness], CapForm["Butt"], Line[Tuples[#][[{1, 2, 4, 3}]]]} & 

Examples:

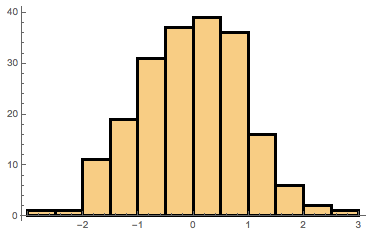
SeedRandom[42]; data = RandomVariate[NormalDistribution[0, 1], 200]; Histogram[data, ChartStyle -> 1, ChartElementFunction -> ceF[][]] 

Mathematica graphics

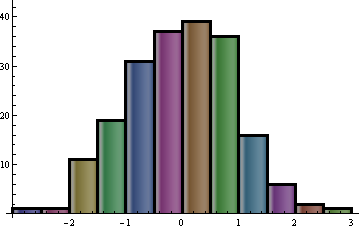
Histogram[data, ChartStyle -> 1, ChartElementFunction -> ceF["FadingRectangle"][Dynamic[Darker@Darker@CurrentValue["Color"]], 5]] 

Mathematica graphics

Histogram[data, ChartStyle -> 1, ChartElementFunction -> ceF["FadingRectangle", "GradientOrigin"->Top][Dynamic[Darker@CurrentValue["Color"]], 5]] 

Mathematica graphics

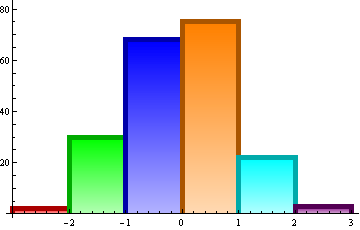
Histogram[data, 5, ChartStyle -> {Red, Green, Blue, Orange, Cyan, Purple}, ChartElementFunction -> ceF["FadingRectangle", "GradientOrigin"->Top][Dynamic[Darker@CurrentValue["Color"]], 5]] 

Mathematica graphics

$\endgroup$
4
  • 1
    $\begingroup$ You can remove parts of lines under the axis by adding CapForm["Butt"]. $\endgroup$ Commented Feb 21, 2017 at 3:14
  • $\begingroup$ Thank you @AlexeyPopkov; good point. Updated with your suggestion. $\endgroup$ Commented Feb 21, 2017 at 3:22
  • $\begingroup$ @kglr very, very nice. I'll give you the accepted answer as it is very detailed and solves all of my problems. $\endgroup$ Commented Feb 23, 2017 at 9:59
  • $\begingroup$ @QuantumPenguin, please see Update 2. $\endgroup$ Commented Feb 19, 2019 at 20:25
8
$\begingroup$

You are looking to modify the EdgeForm of your ChartStyle, and this is shown in the documentation for Histogram, in the Options section.

SeedRandom[42]; data = RandomVariate[NormalDistribution[0, 1], 200]; Histogram[data, ChartStyle -> {EdgeForm[ Directive[AbsoluteThickness[2], Black, Opacity[1]]]}] 

enter image description here

$\endgroup$
1
  • $\begingroup$ B, Also a great answer! I prefer this as it seems to be simpler. Do you know how to remove the edges on the bottom lines that join to the x axis or mask it somehow? $\endgroup$ Commented Feb 20, 2017 at 15:51
8
$\begingroup$

The most direct and versatile way would be to generate your own chart elements. Fortunately, for rectangles this is quite easy:

data = RandomReal[{0, 100}, 1000]; Clear[thick] thick[{{xmin_, xmax_}, {ymin_, ymax_}}, values_, metadata_] := {EdgeForm[Thick], Rectangle[{xmin, ymin}, {xmax, ymax}]} Histogram[data, ChartElementFunction -> thick] 

Mathematica graphics


Once you decide to make your own primitives, you also gain some flexibility, e.g. by choosing to leave off the bottom edge of each bar, as requested in comments:

Clear[thickNoBottom] thickNoBottom[{{xmin_, xmax_}, {ymin_, ymax_}}, values_, metadata_] := { {EdgeForm[None], Rectangle[{xmin, ymin}, {xmax, ymax}]}, {Thickness[0.015], Black, CapForm["Butt"], Line[{{xmin, ymin}, {xmin, ymax}, {xmax, ymax}, {xmax, ymin}}]} } Histogram[data, ChartBaseStyle -> Thick, ChartElementFunction -> thickNoBottom] 

Mathematica graphics

$\endgroup$
5
  • $\begingroup$ @MacroB Nice, I am surprised that there isn't an inbuilt feature for this! $\endgroup$ Commented Feb 20, 2017 at 15:45
  • $\begingroup$ Although, I don't suppose you know how to remove the thickness on the lines where the bar meets the x-axis... $\endgroup$ Commented Feb 20, 2017 at 15:48
  • $\begingroup$ @QuantumPenguin Yes something can be done once you decide to make your own primitives. See edit. $\endgroup$ Commented Feb 20, 2017 at 16:22
  • 1
    $\begingroup$ You can remove parts of lines under the axis by adding CapForm["Butt"]. $\endgroup$ Commented Feb 21, 2017 at 3:14
  • $\begingroup$ @Alexey Thank you for the suggestion: those were in fact bothering me a little! I'll update the answer as soon as I get back to a computer. $\endgroup$ Commented Feb 21, 2017 at 3:57

Start asking to get answers

Find the answer to your question by asking.

Ask question

Explore related questions

See similar questions with these tags.