2
$\begingroup$

I have the following plot showing six curves. The curves "DotDashed Blue and Red" correspond to p=a, "Solid Orange and Magenta" correspond to p=b, and, "Dashed Purple and Gray" correspond to p=c. I want to label these cases in a single Legend as shown

p1 = Plot[{Exp[-x] Sin[5 x], -Exp[-x] Sin[5 x]}, {x, 0, 2 \[Pi]}, PlotRange -> All, PlotStyle -> {{Red, DotDashed}, {Blue, DotDashed}}]; p2 = Plot[{2 Exp[-x] Sin[5 x], -2 Exp[-x] Sin[5 x]}, {x, 0, 2 \[Pi]}, PlotRange -> All, PlotStyle -> {Magenta, Orange}]; p3 = Plot[{4 Exp[-x] Sin[5 x], -4 Exp[-x] Sin[5 x]}, {x, 0, 2 \[Pi]}, PlotRange -> All, PlotStyle -> {{Purple, Dashed}, {Gray, Dashed}}]; join = Show[p3, p2, p1]; Needs["PlotLegends`"] ShowLegend[ Show[join, ImageSize -> 300], {{{Graphics[{{Red, Blue}, DotDashed, Thickness[0.115], Line[{{0, 0}, {2, 0}}]}], Style["p=a", FontFamily -> "Arial", Italic, FontSize -> 8]}, {Graphics[{{Purple, Orange}, Thickness[0.115], Line[{{0, 0}, {2, 0}}]}], Style["p=b", FontFamily -> "Arial", Italic, FontSize -> 8]}, {Graphics[{{Magenta, Gray}, Dashed, Thickness[0.115], Line[{{0, 0}, {2, 0}}]}], Style["p=c", FontFamily -> "Arial", Italic, FontSize -> 8]}}, LegendLabel -> "" , LegendPosition -> {0.461, 0.340}, LegendSize -> {0.45, 0.3}, LegendShadow -> False}] 
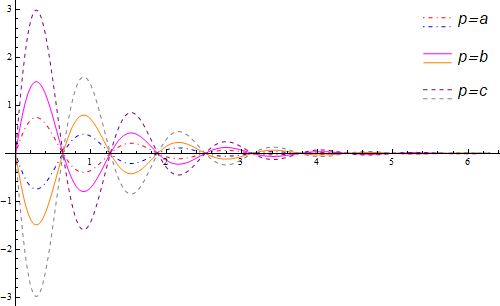
$\endgroup$
3
  • $\begingroup$ What is you Mathematica version exactly? $\endgroup$ Commented Feb 2, 2018 at 9:31
  • $\begingroup$ Hi, I am using Mathematica 10. $\endgroup$ Commented Feb 2, 2018 at 9:41
  • $\begingroup$ Have you seen, that PlotLegends are built-in since version 9.0? $\endgroup$ Commented Feb 2, 2018 at 9:46

1 Answer 1

6
$\begingroup$

Using the function pair from this answer as the setting for LegendLayout:

pair = Grid[MapAt[SpanFromAbove &, #, {2 ;; ;; 2, 2}], Alignment -> {Center, Center}, Spacings -> {1/2, {{1, -0.5}}}] &; labels = Style[#, 16, FontFamily->"Arial", Italic] & /@ {"p=a", "p=b", "p=c"}; styles = {{Red, DotDashed}, {Blue, DotDashed}, Magenta, Orange, {Purple, Dashed}, {Gray, Dashed}}; funcs = Join @@ ({#, -#} & /@ ( Exp[-x] Sin[5 x] 2^Range[0, 2])); Plot[funcs, {x, 0, 2 π}, PlotRange -> All, ImageSize -> 500, PlotStyle -> styles, PlotLegends -> Placed[LineLegend[Riffle[labels, labels], LegendLayout -> pair, LegendMarkerSize -> {30, 15}], {Right, Top}]] 

enter image description here

$\endgroup$
3
  • $\begingroup$ thanks. Can't we have this Legend inside the Figure? $\endgroup$ Commented Feb 2, 2018 at 10:10
  • $\begingroup$ @user149973, please see the update. $\endgroup$ Commented Feb 2, 2018 at 10:21
  • $\begingroup$ thank you so much. $\endgroup$ Commented Feb 2, 2018 at 10:43

Start asking to get answers

Find the answer to your question by asking.

Ask question

Explore related questions

See similar questions with these tags.