3
$\begingroup$

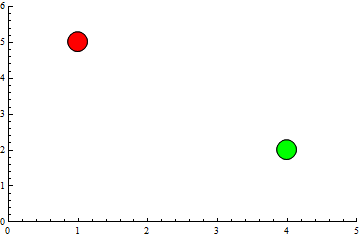
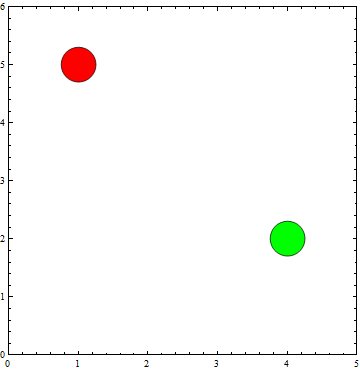
I have a plot as below:

ListPlot[{{{1, 5}}, {{4, 2}}}, PlotStyle -> {{Red, PointSize[0.03]}, {Green, PointSize[0.03]}}, PlotRange -> {{0, 5}, {0, 6}}] 

enter image description here

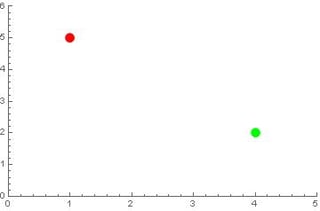
I want to add black circular boundaries for the red and green spots. What can I do?

Many thanks!

$\endgroup$

1 Answer 1

3
$\begingroup$
ListPlot[{{{1, 5}}, {{4, 2}}}, PlotStyle -> {Red, Green}, PlotRange -> {{0, 5}, {0, 6}}, PlotMarkers -> {Graphics[{EdgeForm[Black], Disk[]}], .1}] 

enter image description here

BubbleChart[{{1, 5, .3}, {4, 2, .3}}, ChartStyle -> {Red, Green}, PlotRange -> {{0, 5}, {0, 6}}] 

enter image description here

$\endgroup$
3
  • $\begingroup$ Thanks for your reply. Is it possible to add black at the boundary only instead of adding black at the back? What I want to do is to use Opacity[0], Red instead of just Red to make it transparent, and then add the spots to another plot. So if the black is at the back, there will be no transparency. $\endgroup$ Commented Jul 26, 2018 at 17:31
  • 1
    $\begingroup$ @H42, with EdgeForm[Black] only the edge of the disk is painted black, not the whole disk. $\endgroup$ Commented Jul 26, 2018 at 17:33
  • $\begingroup$ Oh sorry I mixed up the codes. many thanks! $\endgroup$ Commented Jul 26, 2018 at 17:41

Start asking to get answers

Find the answer to your question by asking.

Ask question

Explore related questions

See similar questions with these tags.