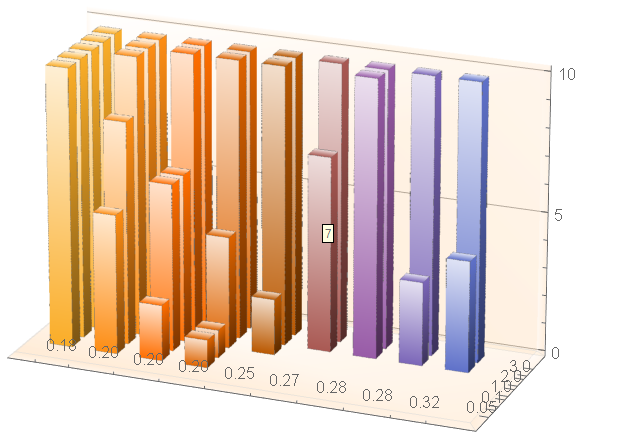
data = {{10,5,2,1,Missing[],Missing[],Missing[],Missing[],Missing[]},{10,8,6,1,Missing[],Missing[],Missing[],Missing[]},{10,10,6,4,2,Missing[],Missing[],Missing[],Missing[]},{10,10,10,10,10,7,10,3,4},{10,10,10,10,10,10,10,10,10}}; BarChart3D[data, BarSpacing-> {1,0.5}, ChartLayout-> "Grid", ChartLabels ->{{"0.05","0.1","1.0","2.0","3.0"},{" 0.18","0.20","0.20","0.20","0.25","0.27","0.28","0.28","0.32"}}, TicksStyle ->{False,False,True}, ViewPoint-> {3.33,-8.26,3.36}, ImageSize->Large] If you plot this code, on the y-axis chart labels will be on top of one another. How would I go about resolving this?
Is there any way to increase the resolution of the graph?