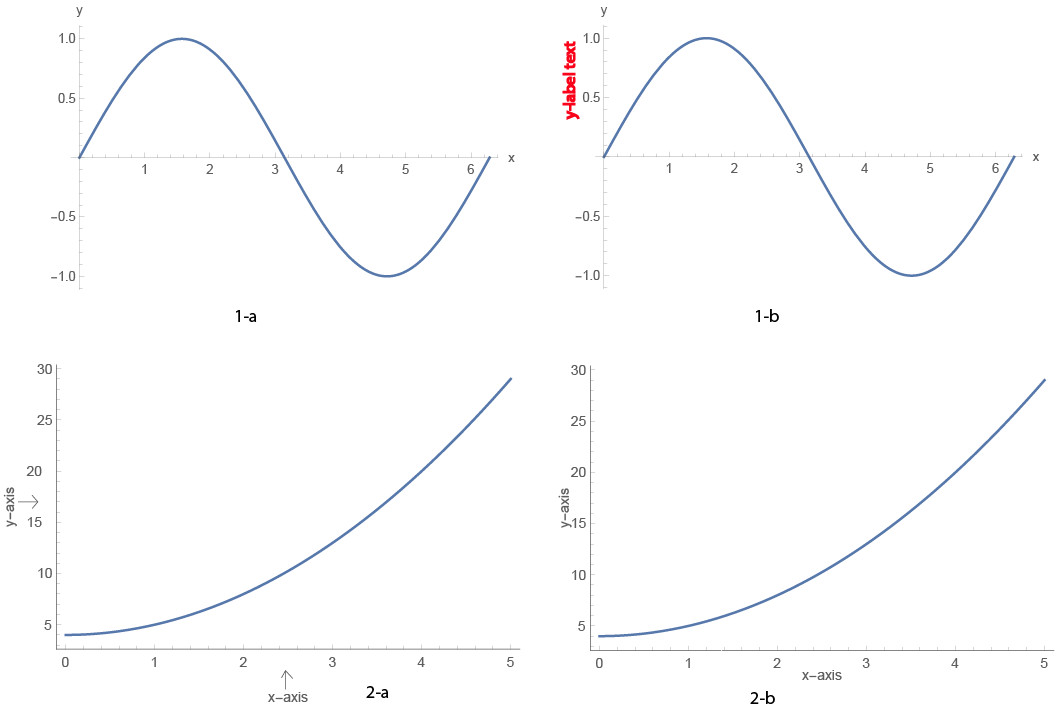
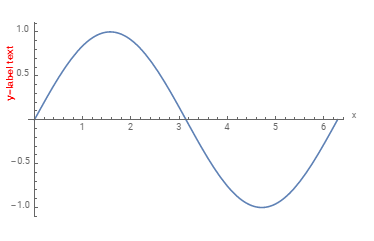
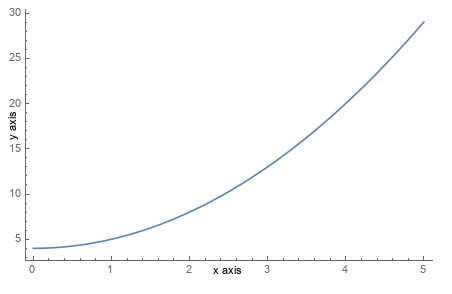
I have studied the relational contents through the webpage Placing x-axes label below rather than at end of axes, but not found: (1)How to put annotation on the left of y axis and display the graphic properly without using FrameLabel. I don't use the function FrameLabel because the curve owns value in the positive and negative y axis. I found if using FrameLabel, the x-direction frame will display on the bottom without overlapping x axis. (2)The webpage didn't point out how to adjust the distance between the text generated from FrameLabel and axis. The default distance between FrameLabel text such as text "x-axis" in the following picture and x axis is very far, so it can not be used in paper directly. So I think it necessary to open a new post here.
In the first row of the following picture, I want to insert an annotation "y-label text" into fig 1-a and make it become into the fig 1-b; the second, move a little bit of "x-axis" and "y-axis" to their axis in the fig 2-a and make it into the fig 2-b. The codes and pictures as follows. How can I achieve the results? Thank you!
For fig 1-a
Plot[Sin[x], {x, 0, 2 Pi}, AxesLabel -> {"x", "y"}, PlotRange -> All] For fig 2-a
Plot[x^2 + 4, {x, 0, 5}, ImageSize -> 500, Axes -> False, Frame -> {{True, False}, {True, False}}, FrameLabel -> {{"y-axis", None}, {"x-axis", None}}, FrameTicks -> All] and the picture: