Suppose that I have matrix matT1 at time t and matT2 at time t+1:
matT1 = { {0.98, 0.95, 1.00, 0.85, 1.40}, {1.46, 0.36, 0.96, 0.15, 0.97}, {0.24, 1.20, 1.40, 0.96, 0.46}, {1.10, 1.30, 0.03, 0.81, 0.53}, {1.30, 1.50, 1.30, 0.51, 0.42} }; matT2 = { {0.44, 1.00, 0.77, 1.20, 0.61}, {0.58, 0.57, 0.65, 0.19, 1.00}, {1.40, 0.14, 1.20, 1.40, 0.96}, {1.40, 0.95, 0.74, 0.56, 0.47}, {0.98, 0.45, 1.30, 0.34, 0.25} }; Note that these matrices represent two different weighted directed graphs with 5 vertices. Elements of these two matrices are assigned to one of the five states s1=[0, 0.5], s2=(0.5, 1], s3=(1, 1.5] etc.
r1T1=BoolEval[0<= matT1<=0.5]/.{1->s1}; r2T1=BoolEval[0.5<matT1<= 1]/.{1-> s2}; r3T1=BoolEval[1<matT1<=1.5]/.{1 -> s3}; r4T1=BoolEval[1.5<matT1<=2]/.{1 -> s4}; r5T1=BoolEval[2<matT1<=2.5]/.{1 -> s5}; matT1S = r1T1 + r2T1 + r3T1 + r4T1 + r5T1 // MatrixForm r1T2=BoolEval[0<=matT2<=0.5]/.{1 -> s1}; r2T2=BoolEval[0.5<matT2<=1]/.{1 -> s2}; r3T2=BoolEval[1<matT2<=1.5]/.{1 -> s3}; r4T2=BoolEval[1.5<matT2<=2]/.{1 -> s4}; r5T2=BoolEval[2<matT2<=2.5]/.{1 -> s5}; matT2S = r1T2 + r2T2 + r3T2 + r4T2 + r5T2 // MatrixForm respectively yield:
matT1S = { {s2, s2, s2, s2, s3}, {s3, s1, s2, s1, s2}, {s1, s3, s3, s2, s1}, {s3, s3, s1, s2, s2}, {s3, s3, s3, s2, s1} }; matT2S = { {s1, s2, s2, s3, s2}, {s2, s2, s2, s1, s2}, {s3, s1, s3, s3, s2}, {s3, s2, s2, s2, s1}, {s2, s1, s3, s1, s1} }; We then derive a map of transition from matT1S to matT2Sby manually comparing the states in both matrices.
Clear[n, states, map]; n = Length[matT2S]; states = {s1, s2, s3, s4, s5}; map = {}; Do[ If[matT1S[[i, j]] == states[[1]] && matT2S[[i, j]] == states[[2]], AppendTo[map, {i, j}] ], {i, n}, {j, n} ] Length[map] (* gives 0 *) For each pair of states, I run the above code to obtain the following map:
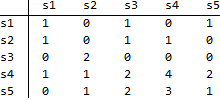
Rows are associated with time t and columns with t+1. This map illustrates that, out of 3 links in state s1 at time t, 1 remains in s1 at t+1, and 1 moves to s3 at t+1 and 1 moves to s5 at t+1. Other numbers in the map should be read likewise. Using this map,
traMap={ {1,0,1,0,1}, {1,0,1,1,0}, {0,2,0,0,0}, {1,1,2,4,2}, {0,1,2,3,1} }; transMatrix= DiagonalMatrix[1/Total[traMap, {2}]].traMap A row-stochastic transition matrix as:
transMatrix = { {1/3, 0, 1/3, 0, 1/3}, {1/3, 0, 1/3, 1/3, 0 }, {0, 1, 0, 0, 0 }, {1/10, 1/10, 1/5, 2/5, 1/5}, {0, 1/7, 2/7, 3/7, 1/7} }; and
MatrixPower[transMatrix, 100] produces the following limiting distribution:
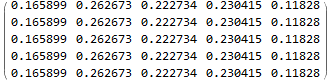
This limiting distribution translates the current vector (3, 3, 2, 10, 7) to (0.17, 0.26, 0.22, 0.23, 0.12)*(3, 3, 2, 10, 7).
My question: Although I found out the transition, I do not know which linkages are in each state in the final period t+100. I like to know the specific linkages associated the new distribution (0.17, 0.26, 0.22, 0.23, 0.12)*(3, 3, 2, 10, 7).
Would it be possible to write a function transMatrix[matrixT_,matrixT1_]:=... to produce: a transition matrix (row stochastic matrix), a final distribution of the linkages across three states, and subsets of the linkages across each state?
s1tos2, the set of binary links with vertex names is {{2,2},{4,3},{3,5}} because I have a total of 5 vertices; froms2tos3, the set of links is {{3,4},{1,4}}; and froms3tos1, the set is {{3,2},{5,2}}. To find the binary links associated with the limiting distribution, we need to identify the specific binary links that is likely to end up with the state implied by the limiting distribution. I hope I am not confusing you. $\endgroup$