0
$\begingroup$

I would like to set a major step in the frame ticks without losing minor ticks.

As example:

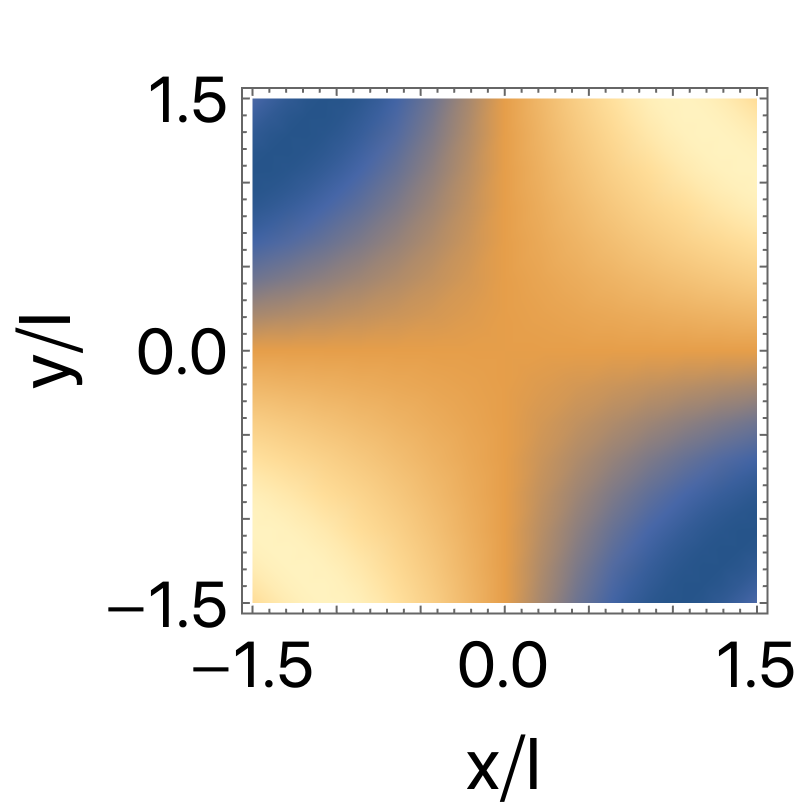
Table[DensityPlot[Sin[x y], {x, -1.5, 1.5}, {y, -1.5, 1.5}, PlotRange -> All, LabelStyle -> {FontFamily -> "Latin Modern Roman", Black, FontSize -> 16}, FrameLabel -> (MaTeX[#, FontSize -> 18] &) /@ {"x/l", "y/l"}, ImageSize -> i], {i, 200, 400, 200}] 

enter image description here

here Mathematica assigned automatically a major step of 0.5 which is not good for me if image's size is small. I would like to set a step of 1.5 but without losing minor ticks, here is how I do that but minor ticks disappear

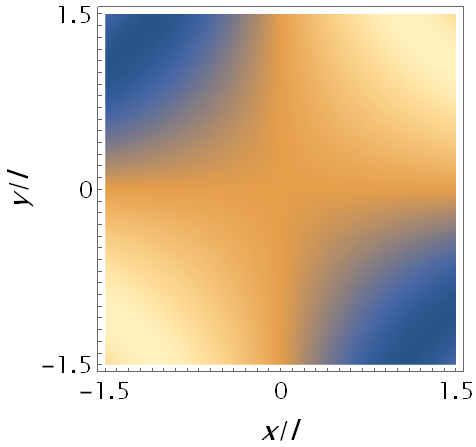
Table[DensityPlot[Sin[x y], {x, -1.5, 1.5}, {y, -1.5, 1.5}, PlotRange -> All, FrameTicks -> {{{-1.5, 0, 1.5}, None}, {{-1.5, 0, 1.5}, None}}, LabelStyle -> {FontFamily -> "Latin Modern Roman", Black, FontSize -> 16}, FrameLabel -> (MaTeX[#, FontSize -> 18] &) /@ {"x/l", "y/l"}, ImageSize -> i], {i, 200, 400, 200}] 

enter image description here

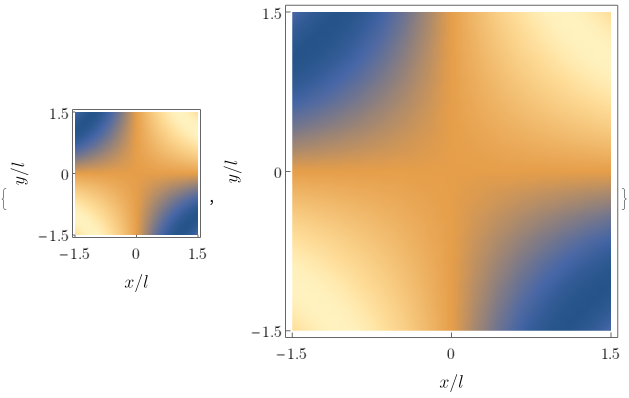
so, how can I always choose my major step without affecting the minor
ones?

$\endgroup$

2 Answers 2

2
$\begingroup$
Clear["Global`*"] 

This will leave all of the major and minor tick marks but remove the tick labels from some of the major ticks.

Show[ denPlt = DensityPlot[ Sin[x y], {x, -1.5, 1.5}, {y, -1.5, 1.5}, PlotRange -> All, LabelStyle -> {FontFamily -> "Latin Modern Roman", Black, FontSize -> 16}, FrameLabel -> (Style[#, 18] & /@ {"x/l", "y/l"}), ImageSize -> 200], FrameTicks -> ( (FrameTicks /. AbsoluteOptions[denPlt, FrameTicks]) /. {x_?(Mod[#, 1.5] != 0 &), str_String, rest__} :> {x, "", rest})] 

enter image description here

$\endgroup$
1
$\begingroup$

Try this:

ticks = Join[{{-1.5, "-1.5"}, {0, "0"}, {1.5, "1.5"}}, Table[{0.1*i, ""}, {i, -14, -1}], Table[{0.1*i, ""}, {i, 1, 14}]] // Sort (* {{-1.5, "-1.5"}, {-1.4, ""}, {-1.3, ""}, {-1.2, ""}, {-1.1, ""}, {-1., ""}, {-0.9, ""}, {-0.8, ""}, {-0.7, ""}, {-0.6, ""}, {-0.5, ""}, {-0.4, ""}, {-0.3, ""}, {-0.2, ""}, {-0.1, ""}, {0, "0"}, {0.1, ""}, {0.2, ""}, {0.3, ""}, {0.4, ""}, {0.5, ""}, {0.6, ""}, {0.7, ""}, {0.8, ""}, {0.9, ""}, {1., ""}, {1.1, ""}, {1.2, ""}, {1.3, ""}, {1.4, ""}, {1.5, "1.5"}} *) 

Then

DensityPlot[Sin[x y], {x, -1.5, 1.5}, {y, -1.5, 1.5}, PlotRange -> All, LabelStyle -> {FontFamily -> "Latin Modern Roman", Black, FontSize -> 16}, FrameTicks -> {{ticks, None}, {ticks, None}}, FrameLabel -> {Style["x/l", 18, Italic], Style["y/l", 18, Italic]}, ImageSize -> 400] 

yielding the following:

enter image description here

Have fun!

$\endgroup$
4
  • $\begingroup$ well, I am aware of such solution, but can we make it general such that I fed mathematica any major step? and this approach is not accurate because all ticks have the same length, major ticks must be longer, and completely removed from top and right side $\endgroup$ Commented Aug 15, 2021 at 9:37
  • 2
    $\begingroup$ mathematica.stackexchange.com/questions/190490/… $\endgroup$ Commented Aug 15, 2021 at 10:44
  • 1
    $\begingroup$ @ valar morghulis I did exactly what you asked. If you need more please take the trouble to explain your need exhaustively. As soon as you are already aware of this solution it will not be difficult for you to make the desired ticks larger. This is elementary. $\endgroup$ Commented Aug 15, 2021 at 18:43
  • $\begingroup$ @AlexeiBoulbitch, thanks a lot for sharing your thoughts. The link provided by Syed discuses the problem in more details. $\endgroup$ Commented Aug 16, 2021 at 6:45

Start asking to get answers

Find the answer to your question by asking.

Ask question

Explore related questions

See similar questions with these tags.