14
$\begingroup$

I'm trying to create some "publication quality" figures, but Mathematica is fighting me all the way. So my question is: Should I switch to Origin? Please help!


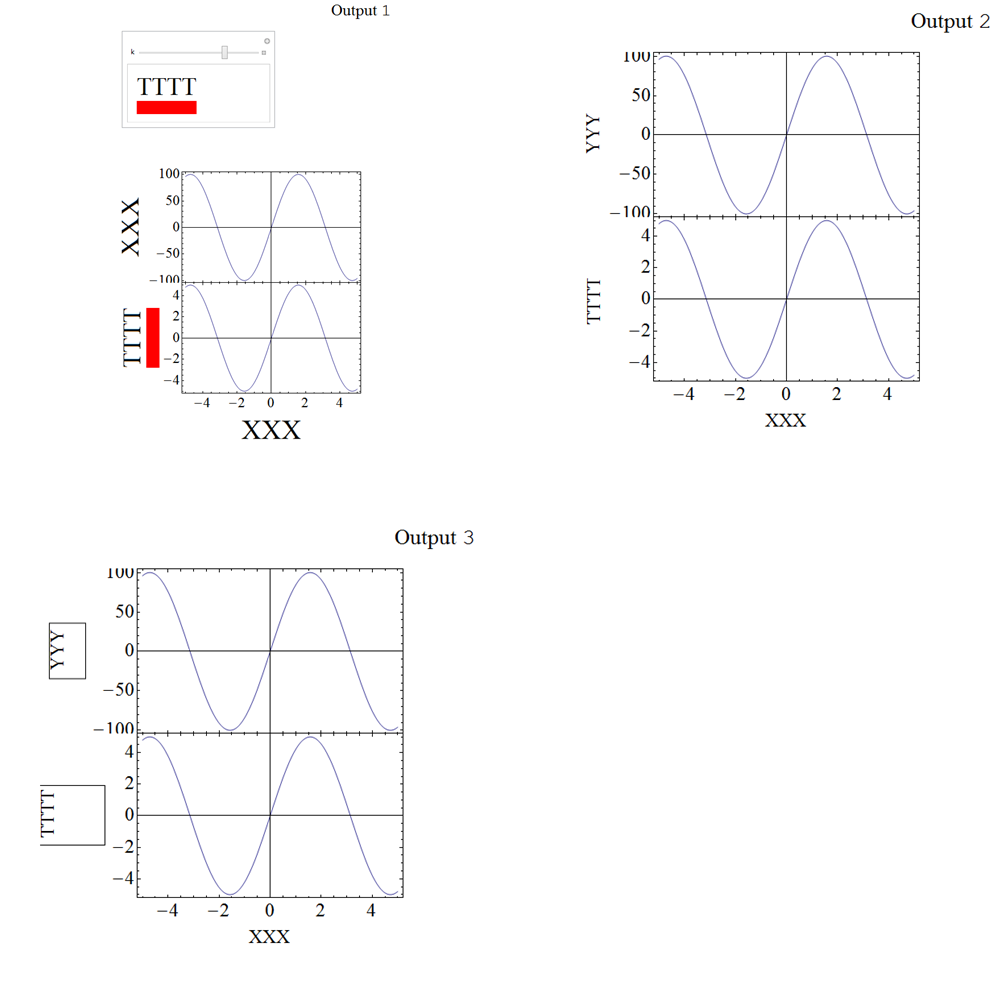
Well, all joking aside: I'm trying to create a multipanel figure. Here is an example:

p1 = Plot[100 Sin@x, {x, -5, 5}, Frame -> True, FrameLabel -> {"XXX", "YYY"}, LabelStyle -> Large, ImageSize -> 400, ImagePadding -> {{100, 1}, {0, 10}}]; p2 = Plot[5 Sin@x, {x, -5, 5}, Frame -> True, FrameLabel -> {"XXX", "TTTT"}, LabelStyle -> Large, ImageSize -> 400, ImagePadding -> {{100, 1}, {40, 0}}]; Column[{p1, p2}, Spacings -> 0] 

Example image

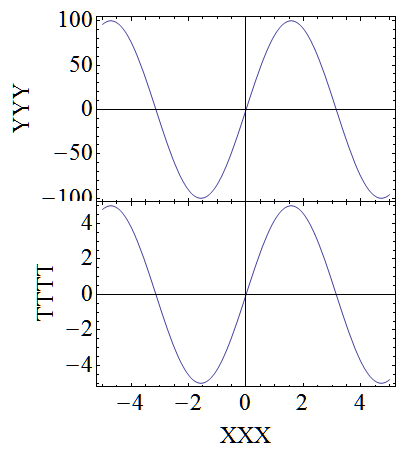
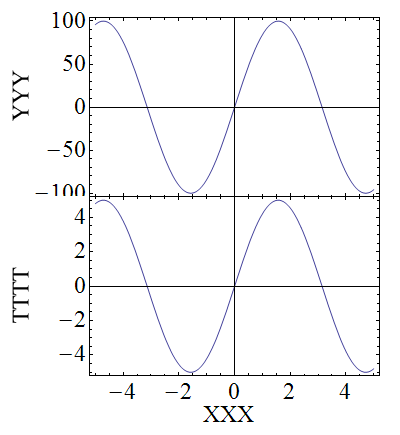
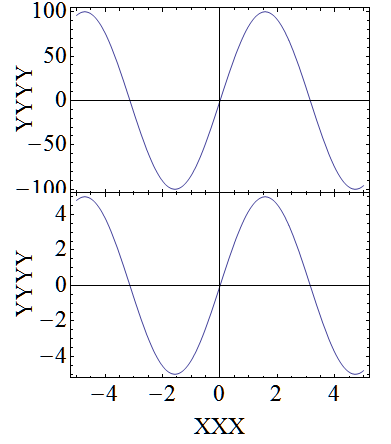
So the real question is: How can I align the TTTT and YYYY axes labels?

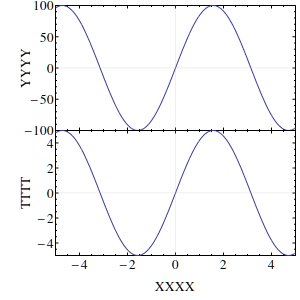
I also tried using grid, with separate labels but then the TTTT is not centered on the axis, but is too low.

$\endgroup$
8
  • 1
    $\begingroup$ Maybe this is related. $\endgroup$ Commented Jun 13, 2013 at 8:40
  • 1
    $\begingroup$ Possibly related: link $\endgroup$ Commented Jun 13, 2013 at 8:45
  • 1
    $\begingroup$ @RodLm It is indeed (only searched google and this site). Inset may be the way to go. $\endgroup$ Commented Jun 13, 2013 at 8:47
  • $\begingroup$ For this answer, you used LevelScheme` . This is the type of thing it was built for. $\endgroup$ Commented Jun 13, 2013 at 12:14
  • $\begingroup$ @rcollyer Indeed! but I can't get rid of the blurry outline (assuming I would like to keep the error bars semi transparent). $\endgroup$ Commented Jun 13, 2013 at 12:20

4 Answers 4

7
$\begingroup$

Mark Caprio's LevelScheme is great for this stuff. Overkill actually ....

Quiet@Needs["LevelScheme`LevelScheme`"] (* plot the functions *) p1 = Plot[100 Sin@x, {x, -5, 5}, Frame -> True, LabelStyle -> Large, ImageSize -> 400, ImagePadding -> {{60, 50}, {0, Automatic}}]; p2 = Plot[5 Sin@x, {x, -5, 5}, Frame -> True, LabelStyle -> Large, ImageSize -> 400, ImagePadding -> {{60, 50}, {Automatic, 0}}]; (* define grids *) grd1 = Graphics[{Directive[Lighter@Gray, Thin], Line[{{-5, 0}, {5, 0}}], Line[{{0, -100}, {0, 100}}] }]; grd2 = Graphics[{Directive[Lighter@Gray, Thin], Line[{{-5, 0}, {5, 0}}], Line[{{0, -100}, {0, 100}}] }]; (* assemble figure *) Figure[{ Multipanel[{2, 1}, XPanelSizes -> 1, YPanelSizes -> {.5, .5}, XPlotRanges -> {-5, 5}, YPlotRanges -> {{-100, 100}, {-5, 5}}, XFrameLabels -> "XXXX", YFrameLabels -> {"YYYY", "TTTT"}, Margin -> {{55, 5}, {45, 5 }}, BufferB -> 5, BufferL -> 5 ], FigurePanel[{1, 1}, ShowPanelLetter -> False], RawGraphics@p1, RawGraphics@grd1, FigurePanel[{2, 1}, ShowPanelLetter -> False], RawGraphics@p2, RawGraphics@grd2 }, ImageSize -> {300, 300} ] 

Level scheme graphics

$\endgroup$
11
  • 1
    $\begingroup$ +1 I agree completely. I thought RawGraphics did'nt work work with ListErrorPlot, but it seems it works "well enough" i.sstatic.net/eizr8.png (the plot markers for some reason al drawn all over the place) $\endgroup$ Commented Jun 14, 2013 at 8:52
  • $\begingroup$ Also, why Quiet@Needs["LevelScheme`LevelScheme`"] instead of just Needs["LevelScheme`"]? $\endgroup$ Commented Jun 14, 2013 at 8:57
  • $\begingroup$ @Ajasja: I'm using an older version which loads (in 9.0) with warning messages. Regarding your first comment, I would suggest examining your plot ranges. $\endgroup$ Commented Jun 14, 2013 at 9:33
  • $\begingroup$ @dws yes, I realize I could change the plot range. I just find it interesting that lines are clipped, but not plot markers. $\endgroup$ Commented Jun 14, 2013 at 9:37
  • $\begingroup$ Sorry to bump this with a not so related question, but when I run your code (@dwa) I get the errors Scheme::prange: No value specified for option PlotRange. Assuming default value {{0,1},{0,1}}. and Multipanel::lsargs: Missing or unexpected arguments in level scheme object Multipanel[{2,1},XPanelSizes->1,YPanelSizes->{0.5,0.5},.... What is wrong? $\endgroup$ Commented Jan 27, 2014 at 19:24
4
$\begingroup$

I would like to do it with Grid:

p1 = Plot[100 Sin@x, {x, -5, 5}, Frame -> True, LabelStyle -> Large, ImageSize -> 400, ImagePadding -> {{60, 50}, {0, Automatic}}]; p2 = Plot[5 Sin@x, {x, -5, 5}, Frame -> True, LabelStyle -> Large, ImageSize -> 400, ImagePadding -> {{60, 50}, {Automatic, 0}}]; Grid[{{ Rotate[Style["YYY", "Graphics", Large, RGBColor[0, 0, 0, .999]], π/2], Rotate[Style["TTTT", "Graphics", Large, RGBColor[0, 0, 0, .999]], π/2], ""}, {p1, p2, Style["XXX", "Graphics", Large]} }\[Transpose], Spacings -> {0, 0}, ItemSize -> Full] 

grid alignment

$\endgroup$
6
  • $\begingroup$ Yup, I tried that. But then TTTT is off center. Although in my case I did not label the X axes with a grid, so it was even more noticeable. A fake example here i.sstatic.net/gCEkH.png $\endgroup$ Commented Jun 13, 2013 at 8:51
  • $\begingroup$ @Ajasja I remember there is a question about this off-center issue. But I can't remember any keyword for now.. :( $\endgroup$ Commented Jun 13, 2013 at 8:53
  • $\begingroup$ @Ajasja OK my memory lapses.. It's about FrameLabel not printing completely.. But I think you can align your labels more easily with Alignment option of Grid. $\endgroup$ Commented Jun 13, 2013 at 9:03
  • $\begingroup$ @Ajasja Also you can use Spacer[...] to support any boxes. $\endgroup$ Commented Jun 13, 2013 at 9:10
  • $\begingroup$ Thanks, didn't know about spacer. $\endgroup$ Commented Jun 13, 2013 at 9:19
4
$\begingroup$

In the end I used Epilog with Text. The downside of this approach is that the plot label style is not automatically picked up. I really have to learn to better use LevelScheme some day... (or matplotlib:)

p1=Plot[100 Sin@x,{x,-5,5},Frame->True,FrameLabel->{"XXX",""},LabelStyle->Large ,ImageSize->400,ImagePadding->{{100,1},{0,10}},PlotRangeClipping->False ,Epilog->{Text[Rotate[Style[#,Large],\[Pi]/2]&@"YYYY",Scaled[{-0.15,0.5}]]}]; p2=Plot[5 Sin@x,{x,-5,5},Frame->True,FrameLabel->{"XXX",""},LabelStyle->Large ,ImageSize->400,ImagePadding->{{100,1},{Automatic,0}},PlotRangeClipping->False ,Epilog->{Text[Rotate[Style[#,Large],\[Pi]/2]&@"YYYY",Scaled[{-0.15,0.5}]]}]; Column[{p1,p2},Spacings->0] 

Example image

$\endgroup$
1
$\begingroup$

Method 1 Rasterize FrameLabel


Control the size with ImagePad, and need Raterize for ImagePad.

======================================================================Input 1

  1.  rasterizePad[x_, pad_: {{0, 0}, {0, 0}}] := Rasterize[ ImagePad[Rasterize[Style[ToString@x, FontFamily -> Times], ImageSize -> 100], t = pad, Red]] frameLables11 = rasterizePad[XXX]; frameLables12 = rasterizePad[YYY]; frameLables21 = rasterizePad[XXX]; Manipulate[ frameLables22 = rasterizePad[TTTT, {{0, 0}, {k, 0}}], {k, 0, 30, 1}] p11 = Plot[100 Sin@x, {x, -5, 5}, Frame -> True, FrameLabel -> {frameLables11, frameLables11}, LabelStyle -> Large, ImageSize -> 400, ImagePadding -> {{100, 1}, {0, 40}}]; p12 = Plot[5 Sin@x, {x, -5, 5}, Frame -> True, FrameLabel -> {frameLables21, Dynamic@frameLables22}, LabelStyle -> Large, ImageSize -> 400, ImagePadding -> {{100, 1}, {100, 0}}]; Dynamic@Column[{p11, p12}, Spacings -> 0] 

Method 2 use Graphics FrameLabel


======================================================================Input 2

  1.  frameGraphics = Graphics[{Text[Style["TTTT", FontSize -> 24], {0, 1}], {Opacity[0], Rectangle[{0, 0}, {1, 1}]}}, ImageSize -> {100, 50}]; p21 = Plot[100 Sin@x, {x, -5, 5}, Frame -> True, FrameLabel -> {"XXX", "YYY"}, LabelStyle -> Large, ImageSize -> 500, ImagePadding -> {{120, 50}, {0, 0}}]; p22 = Plot[5 Sin@x, {x, -5, 5}, Frame -> True, FrameLabel -> {"XXX", frameGraphics}, LabelStyle -> Large, ImageSize -> 500, ImagePadding -> {{120, 50}, {60, 0}}]; Column[{p21, p22}, Spacings -> 0] 

Method 3(failed)


As @silvia mentioned in her comment of her answer about Spacers.

So I tried this:

I think I failed here in using Sapcings,Column and Spacers

======================================================================Input 3

  1.  p31 = Plot[100 Sin@x, {x, -5, 5}, Frame -> True, FrameLabel -> {"XXX", Column[{"YYY", ""}, Spacings -> 0, Frame -> True]}, LabelStyle -> Large, ImageSize -> 500, ImagePadding -> {{120, 50}, {0, 0}}]; p32 = Plot[5 Sin@x, {x, -5, 5}, Frame -> True, FrameLabel -> {"XXX", Column[{"TTTT", Spacer[{0, 1}]}, Spacings -> 1, Frame -> True]}, LabelStyle -> Large, ImageSize -> 500, ImagePadding -> {{120, 50}, {60, 0}}]; Column[{p31, p32}, Spacings -> 0] 

Any Suggestions?

enter image description here

$\endgroup$

Start asking to get answers

Find the answer to your question by asking.

Ask question

Explore related questions

See similar questions with these tags.